# Overview

Logilica is a Software Engineering Intelligence Platform that enables engineering and product teams to holistically track their delivery forecasts, improve their organisational effectiveness and align with business objectives.

To minimize ramp-up time, the Logilica platform comes with pre-built reporting and rich context specific drill-downs, including for common industry benchmarks such as SPACE, SAFe, and DORA.

Logilica empowers enterprise users to fully **customize** all insights and reporting through comprehensive access to their embedded analytics **DataStudio**.

Logilica’s **open architecture**, which supports flexible data import and export for integration with in-house systems, makes it a versatile solution for the modern enterprise.

## Logilica Architecture Overview

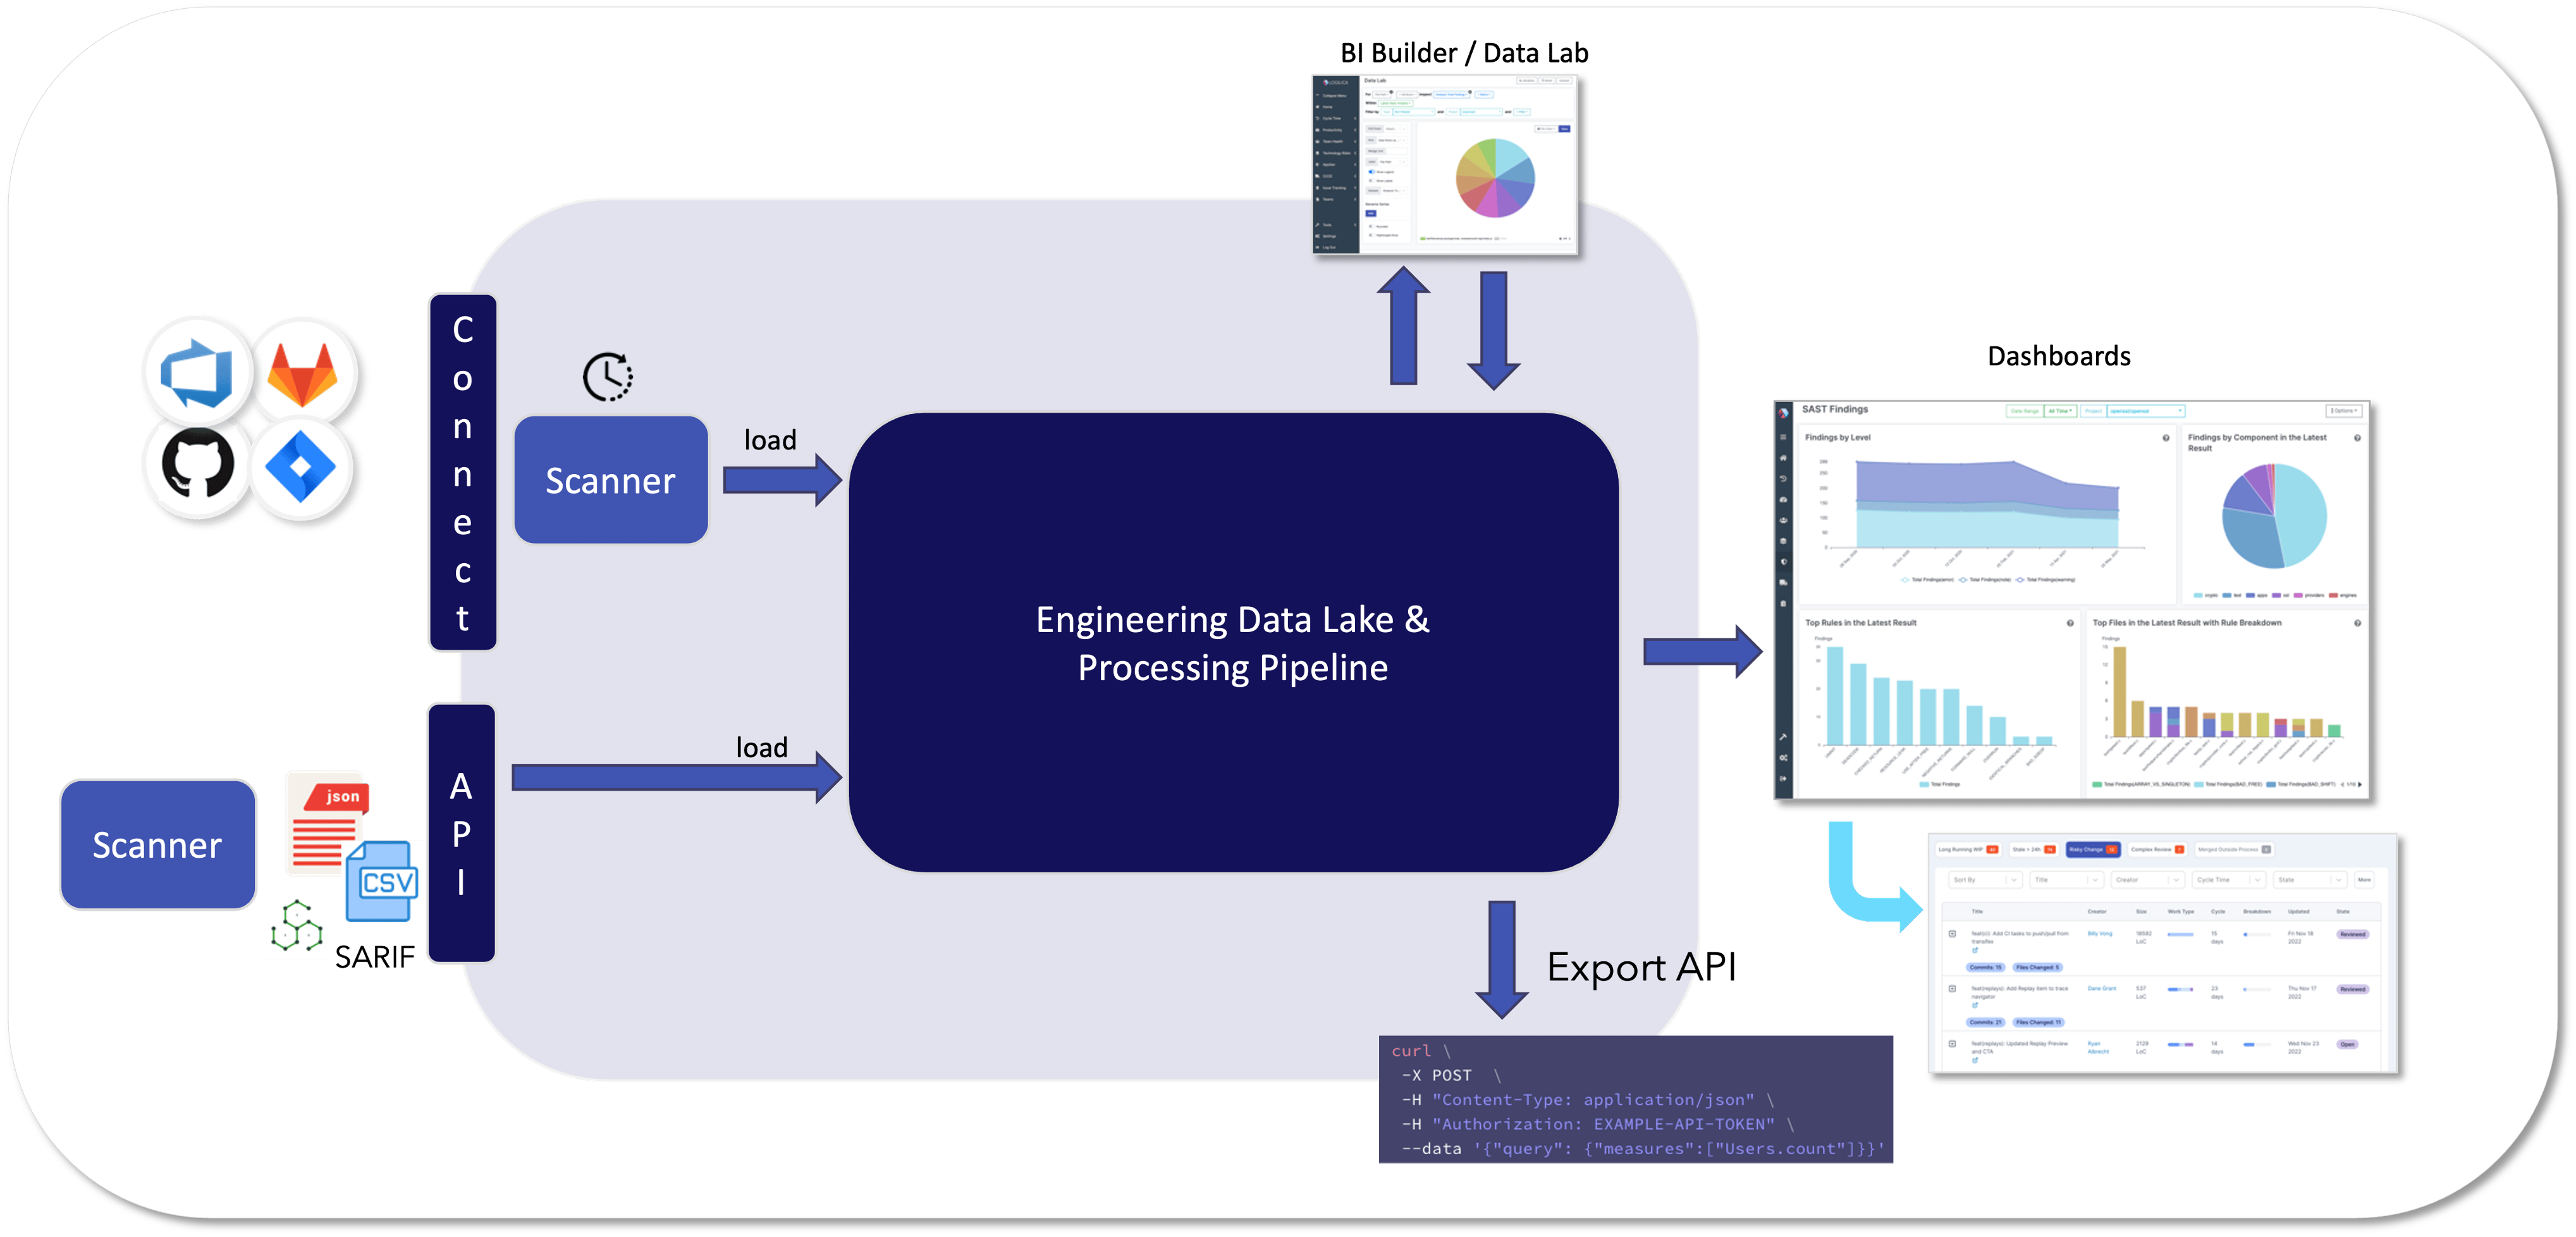
Logilica connects to your engineering tools through first-class connectors and regularly scans your metadata for updates to commute metrics and insights. We also provide upload APIs for custom data and custom connector types.

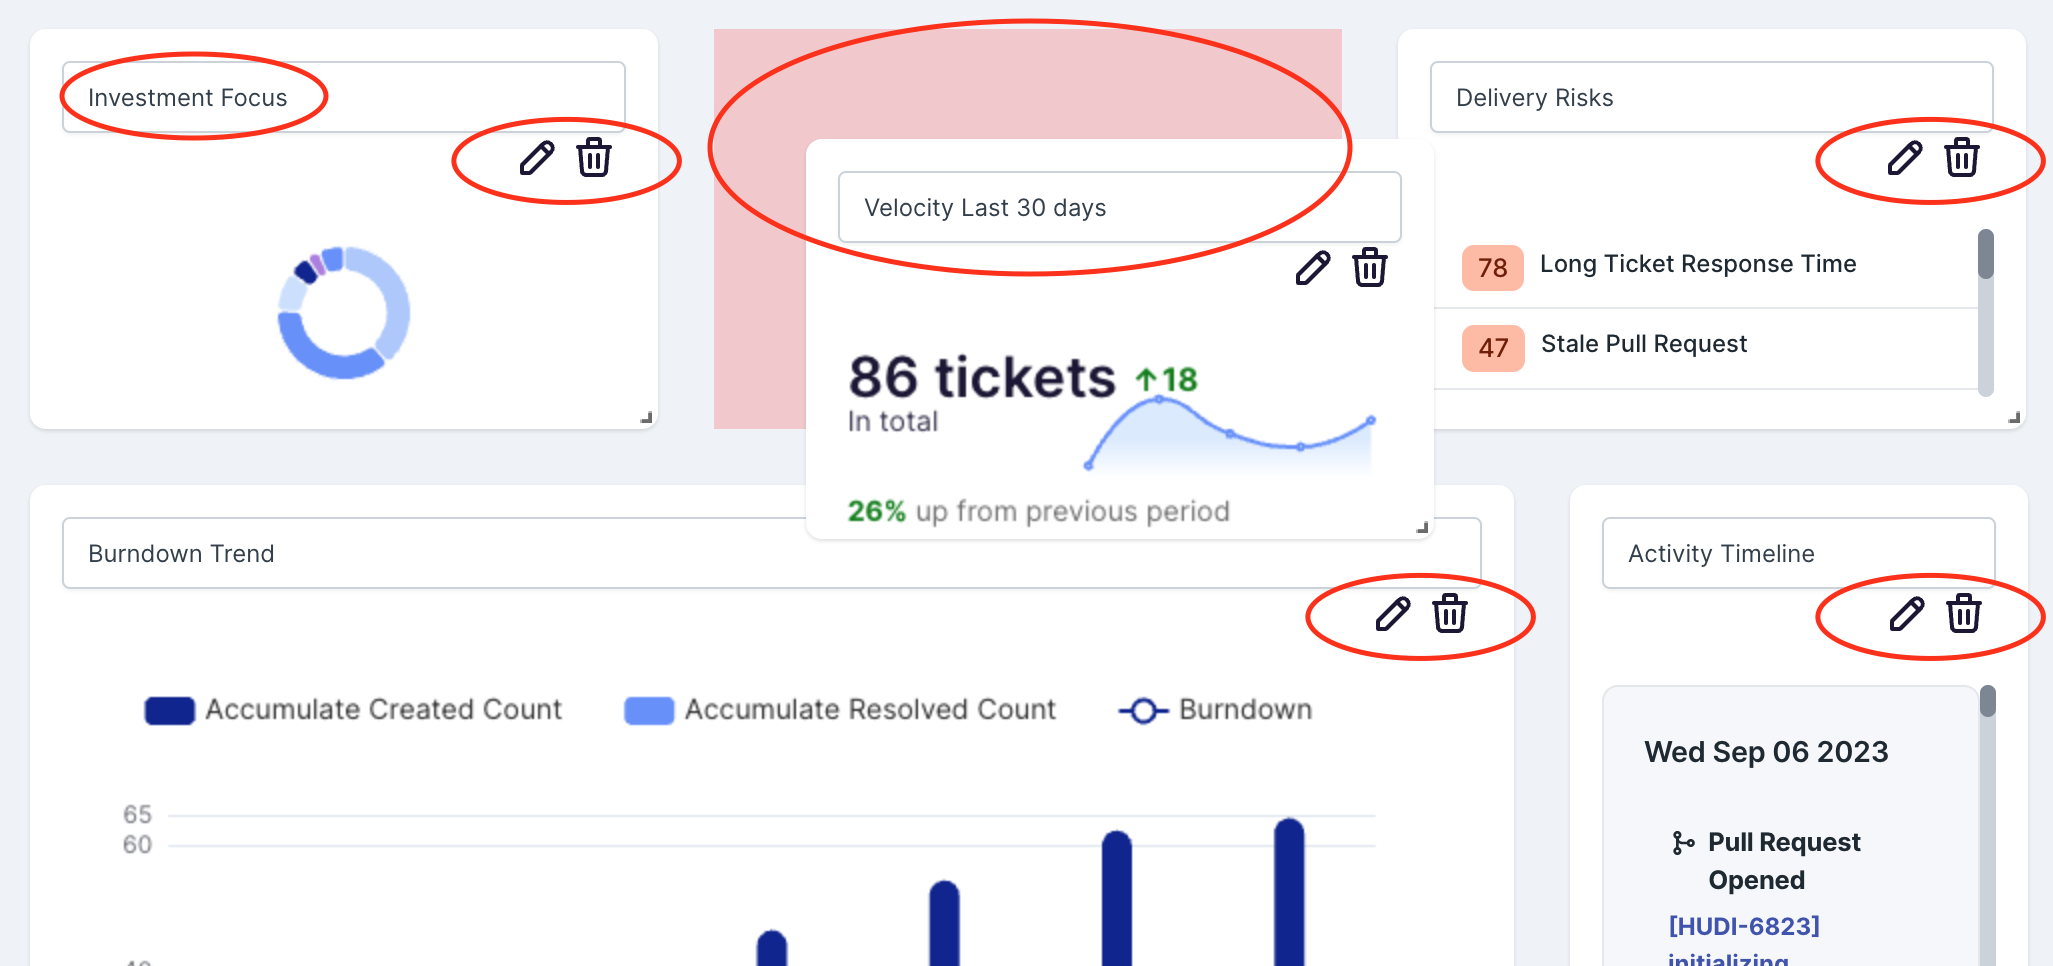
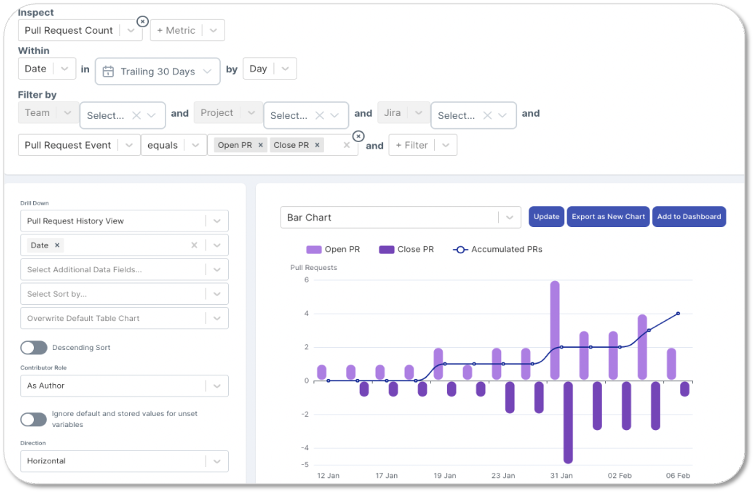
Logilica's embedded analytics engine, DataStudio, computes correlations, insights and forecasts from the ingested data in an intelligent data pipeline, scaling with your organisation. The DataStudio is also accessible to end users so they can build their own insights and dashboards.

<figure><img src="https://3637178088-files.gitbook.io/~/files/v0/b/gitbook-x-prod.appspot.com/o/spaces%2FvMP8keAdyp2axoLILtL5%2Fuploads%2Fgit-blob-97de9cfd0ee888f0962ae66a97ce39cd65d89fca%2FLogilica%20architecture.png?alt=media" alt="" width="563"><figcaption><p>Logilica Overview</p></figcaption></figure>

We are always expanding Logilica's capabilities and features. Don't hesitate to contact the support team below if you have any suggestions on improving the platform.

## Quick Links

{% content-ref url="/pages/WRm6b9OBRIC9hHVmeQ5K" %}
[Onboarding Data](/getting-started/onboarding-data)
{% endcontent-ref %}

{% content-ref url="/pages/dSAH5ao5oXAo4gwA6ayT" %}
[Connecting Tools](/integration/connecting-tools)
{% endcontent-ref %}

{% content-ref url="/pages/qSNvQPDQlFQyKHWjRuNA" %}
[Introduction](/metrics-and-reports/introduction)
{% endcontent-ref %}

{% content-ref url="/pages/Him7fvwMzQXZdfegaSi7" %}
[Best Practices](/advanced/best-practices)
{% endcontent-ref %}

## Support

If you cannot find what you are looking for, reach out to us at <support@logilica.com>.


# Onboarding Data

## Connecting Your Tools

Logilica ingests data from common DevOps and Platform Engineering products and creates out-of-the-box metrics, dashboards and reports. The first step after creating your account is to connect the tools your teams use.

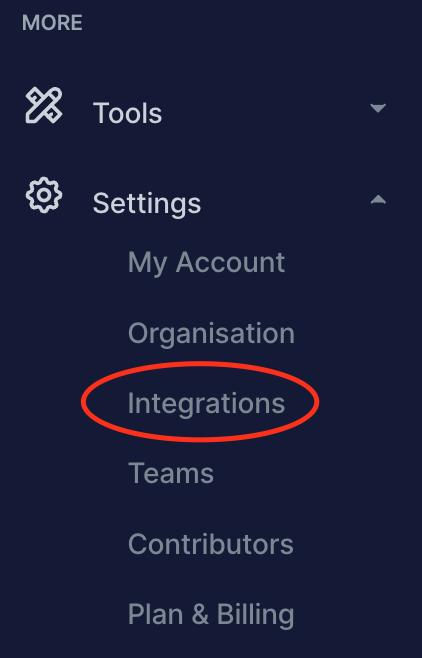
To connect your data sources, navigate on the sidebar to **Settings -> Integrations**.

<figure><img src="https://3637178088-files.gitbook.io/~/files/v0/b/gitbook-x-prod.appspot.com/o/spaces%2FvMP8keAdyp2axoLILtL5%2Fuploads%2Fgit-blob-bb5620e2301c6e14cf2a3f0ba9731c75fc967339%2Fintegration%20-%20sidebar.png?alt=media" alt="" width="211"><figcaption></figcaption></figure>

For a complete list of supported connectors and their configuration details, see [Connecting Tools](/integration/connecting-tools).

## What to Expect After Connecting

Once you install a connector, Logilica begins importing your data. Here's what to expect:

* **Initial import takes minutes to hours** depending on the size of your organisation and the data source. Large GitHub organisations with many repositories may take longer.
* **First import covers the last 6 months.** Only data updated within the last 6 months is imported on the first scan. Older data that hasn't been touched won't appear. Importing data older than 6 months requires a configuration change by Logilica — contact support.
* **Subsequent syncs happen automatically.** After the initial import, Logilica polls for new data on a regular schedule — you don't need to re-trigger imports manually.
* **Dashboards populate as data arrives.** You'll see metrics and charts start to appear within minutes of the first import completing.

## Recommended Onboarding Order

1. **Connect your code hosting platform** (GitHub, GitLab, Bitbucket, or Azure DevOps) — this gives you PR cycle time, coding velocity, and review process metrics immediately
2. **Connect your issue tracker** (Jira, GitHub Projects, GitLab Issues, Azure DevOps Boards, or YouTrack) — this adds planning metrics, sprint health, and lead time tracking
3. **Connect your CI/CD provider** if it's not already embedded in your code platform (CircleCI, BuildKite) — this adds build reliability and DORA metrics
4. **Set up teams** — see [Setting up Teams](/getting-started/setting-up-teams) to group contributors and filter dashboards by team
5. **Invite users** — see [Onboarding Users](/getting-started/onboarding-users) to give your team access to the platform

## Next Steps

* [Connecting Tools](/integration/connecting-tools) — detailed connector reference with authentication methods and data imported per platform
* [Setting up Teams](/getting-started/setting-up-teams) — group contributors into teams for filtered dashboards
* [Onboarding Users](/getting-started/onboarding-users) — invite team members and assign roles


# Onboarding Users

## Users vs Contributors

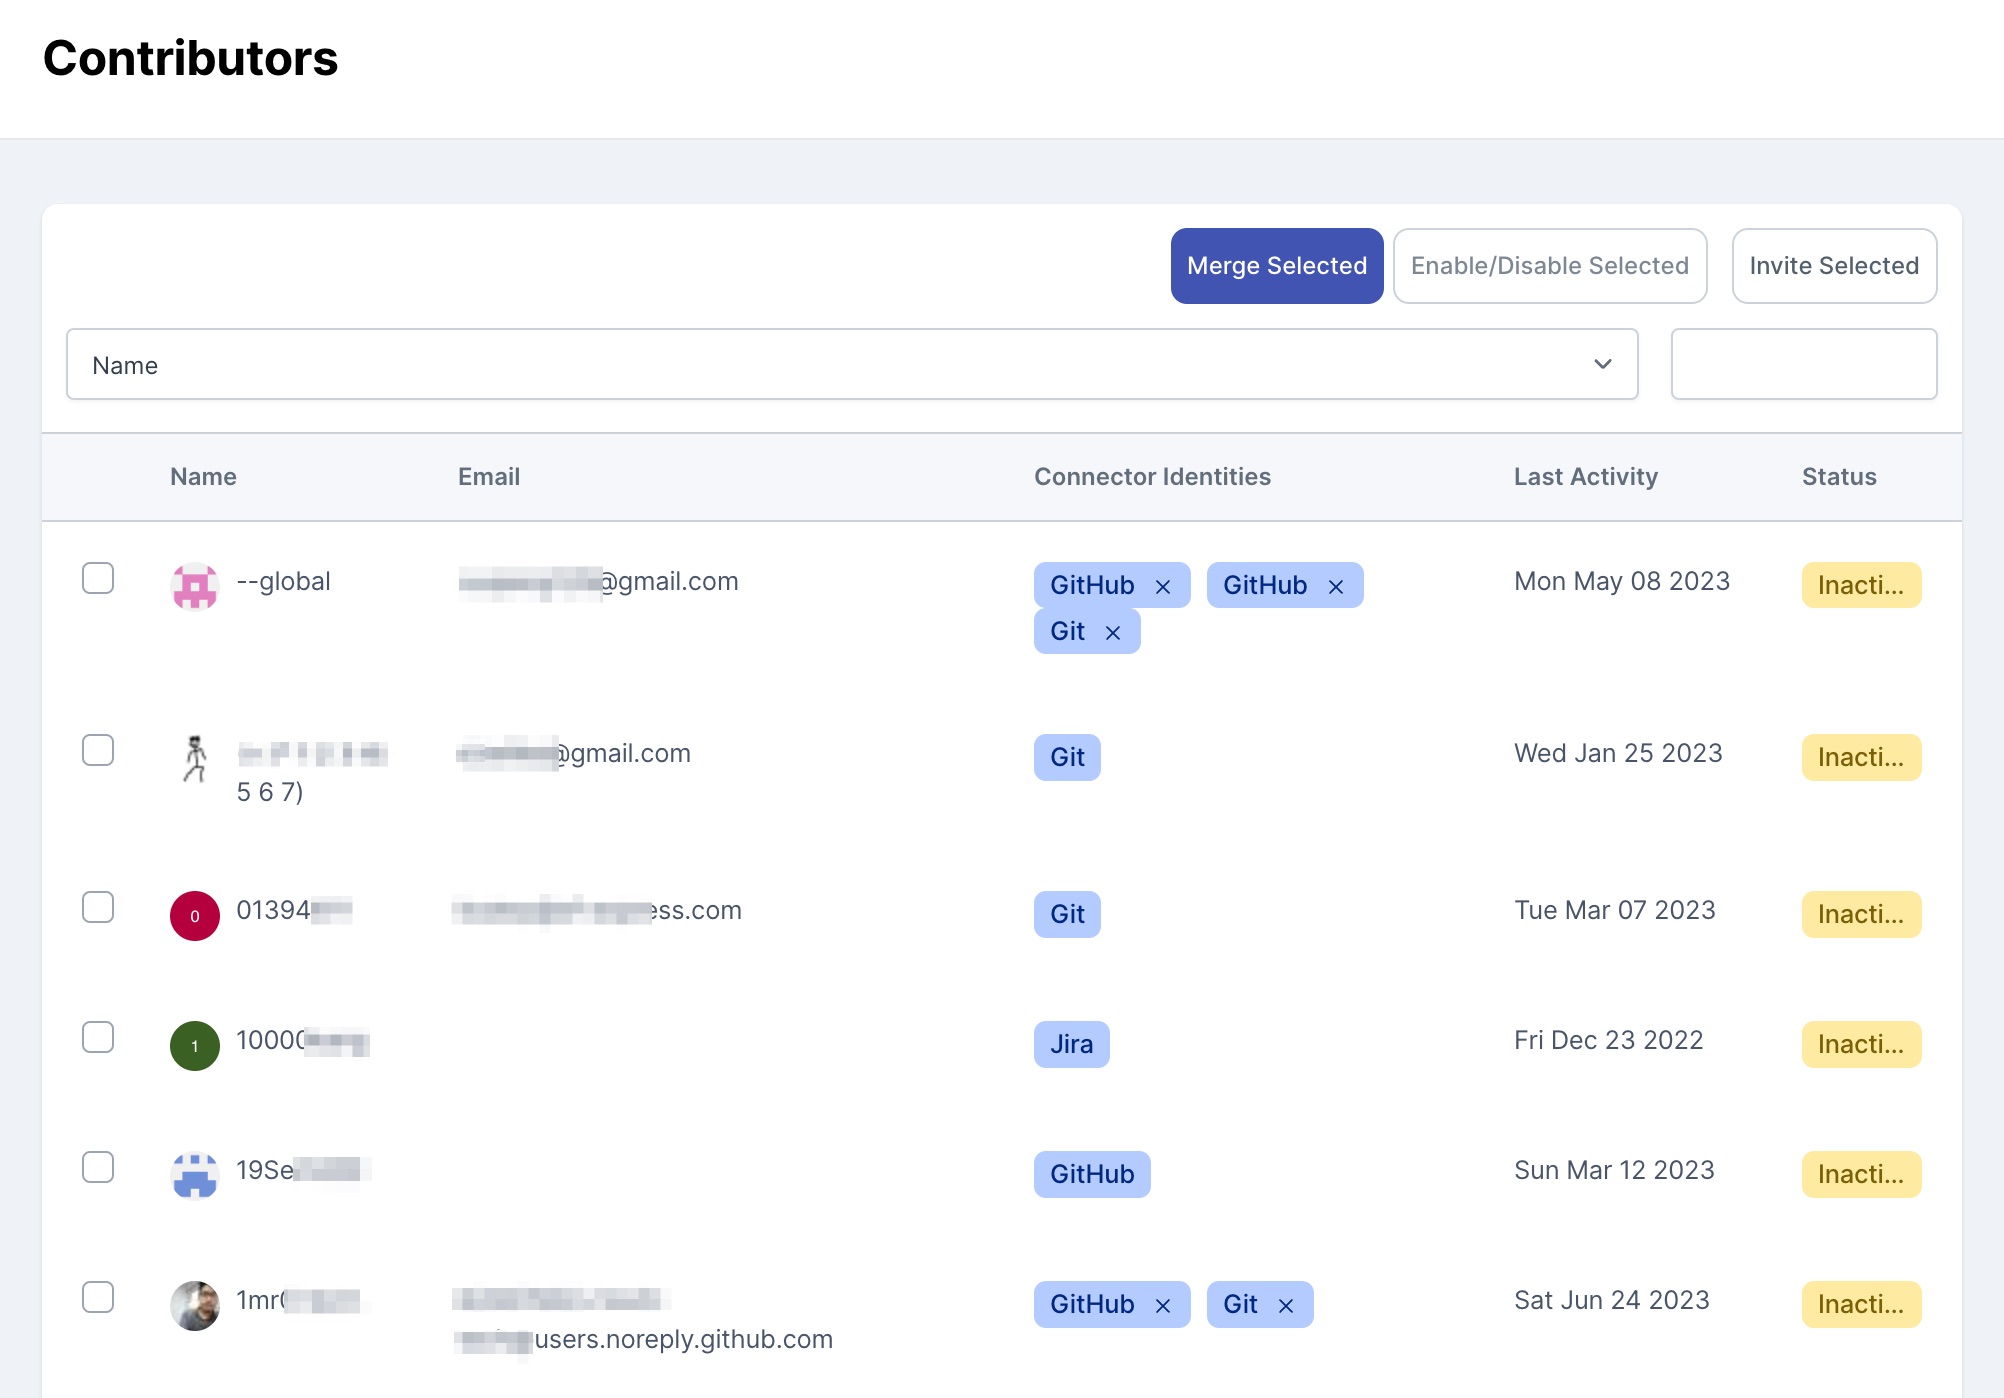
Logilica has the concept of **Contributors** and **Users**.

* **Contributors** are all individuals in an organisation who contributed to the data imported into Logilica. For instance, if you connect a repository, anyone who has been active on that repository recently will be counted as a contributor. Contributors do not have access to the Logilica platform by default. You will need to make them users.
* **Users** are individuals who have been given access to the Logilica platform. These can be contributors, but also others from your organisation, such as the management team, who might not actively contribute to code, etc.

## Adding Users

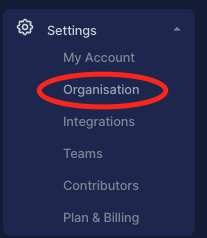
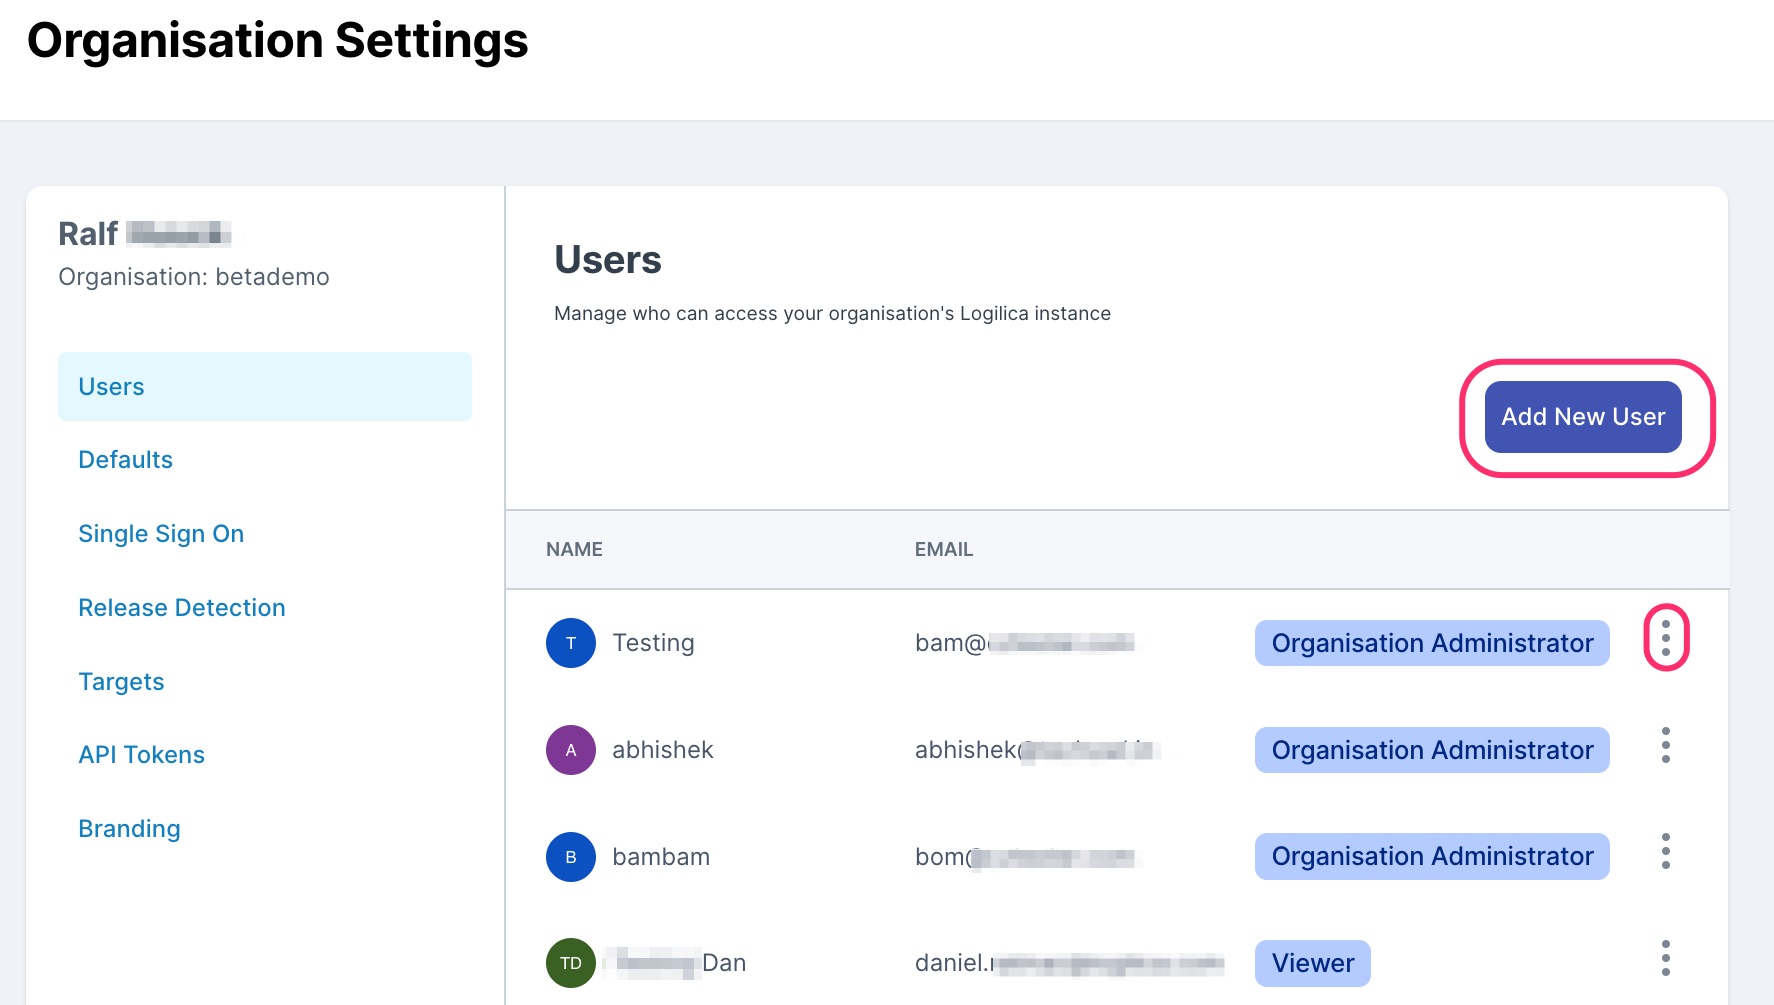
To add new users, navigate to your **Organisation** **settings**.

<figure><img src="https://3637178088-files.gitbook.io/~/files/v0/b/gitbook-x-prod.appspot.com/o/spaces%2FvMP8keAdyp2axoLILtL5%2Fuploads%2Fgit-blob-bacf958e7456924c629d0bd121d6530ec77a1304%2Fusers%20onboarding.png?alt=media" alt=""><figcaption></figcaption></figure>

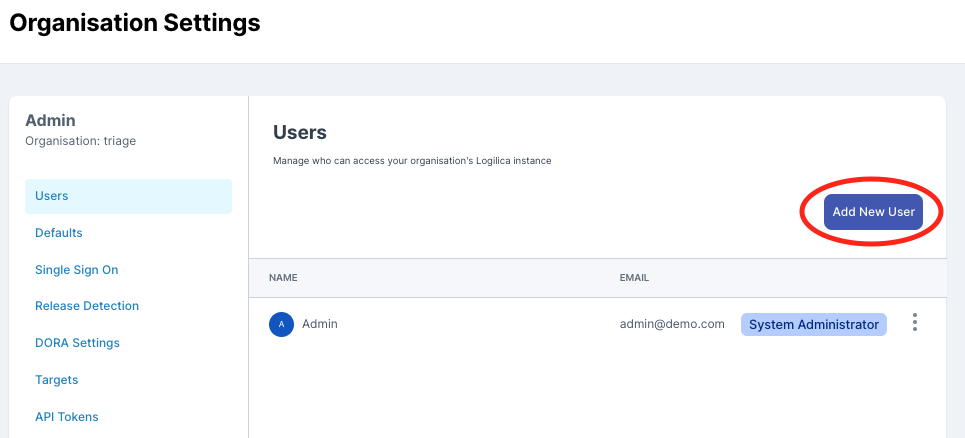
Under the organisation settings, there is a section to invite and manage users as well as their access control rights.

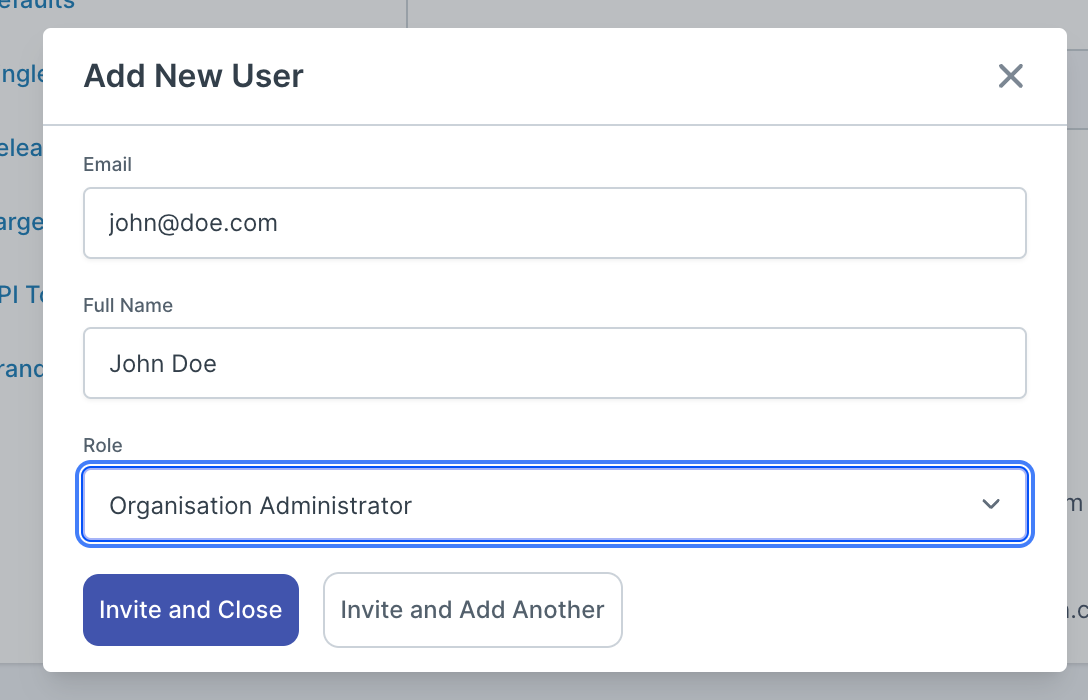
<figure><img src="https://3637178088-files.gitbook.io/~/files/v0/b/gitbook-x-prod.appspot.com/o/spaces%2FvMP8keAdyp2axoLILtL5%2Fuploads%2Fgit-blob-ba4fcc430cdd9e5db44d7320878e83289513a180%2Fadd%20user.png?alt=media" alt=""><figcaption></figcaption></figure>

## Sending Invitations

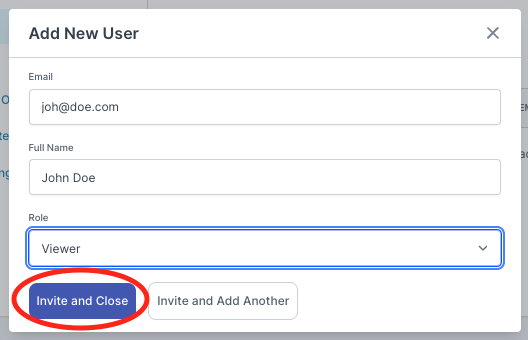
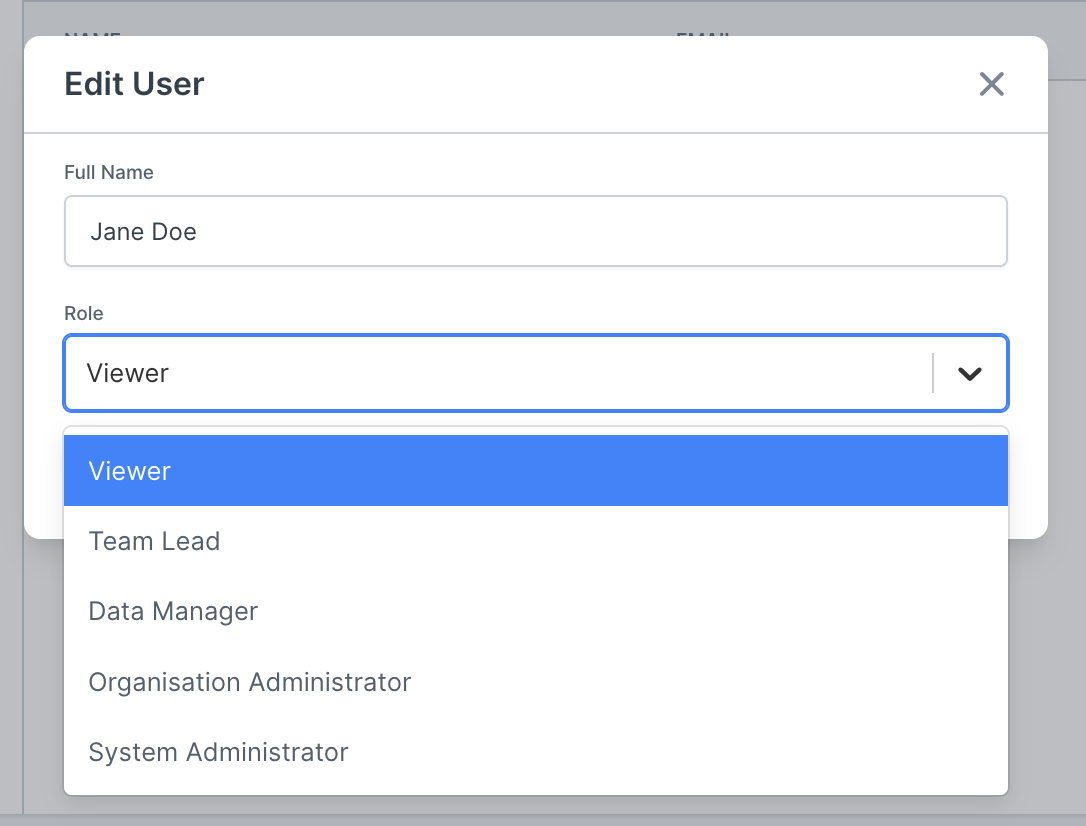
Once you select Add New User, you will be asked to provide the contact details (name/email) of that user as well as an access level.

<figure><img src="https://3637178088-files.gitbook.io/~/files/v0/b/gitbook-x-prod.appspot.com/o/spaces%2FvMP8keAdyp2axoLILtL5%2Fuploads%2Fgit-blob-f3cc374f0b44d56495357e588a711ab727869b9e%2Finvite%20user.png?alt=media" alt="" width="396"><figcaption></figcaption></figure>

The system will email a **temporary link** **valid for 5 days** for that user to accept the invit&#x65;**.**

As an administrator, you can add, delete and manage users. You can also cancel invitations.

If you would like to bulk onboard users or have other questions, please contact <support@logilica.com>.


# Setting up Teams

## What are Teams?

Teams are groups of contributors, i.e., individuals who have their data integrated with Logilica. Logilica supports two team concepts: **managed teams** and **synchronized teams**.

* **Managed teams** are groups of individuals defined by the Logilica platform administrator or team administrators. You can see teams as individuals being labelled with a team name.
* **Synchronized teams** are teams defined externally, for instance, in GitHub or Jira, and are synchronized across Logilica. There are settings in the integration connector where you can enable/disable synchronized teams.

## Navigate to Team Settings

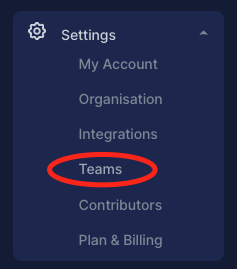
Teams can be set up during onboarding or subsequently through your settings pages.

<figure><img src="https://3637178088-files.gitbook.io/~/files/v0/b/gitbook-x-prod.appspot.com/o/spaces%2FvMP8keAdyp2axoLILtL5%2Fuploads%2Fgit-blob-9514d30487789d4a950063e471575eafcf6c8c59%2Fteam%20sidebar.png?alt=media" alt=""><figcaption></figcaption></figure>

## Teams Overview

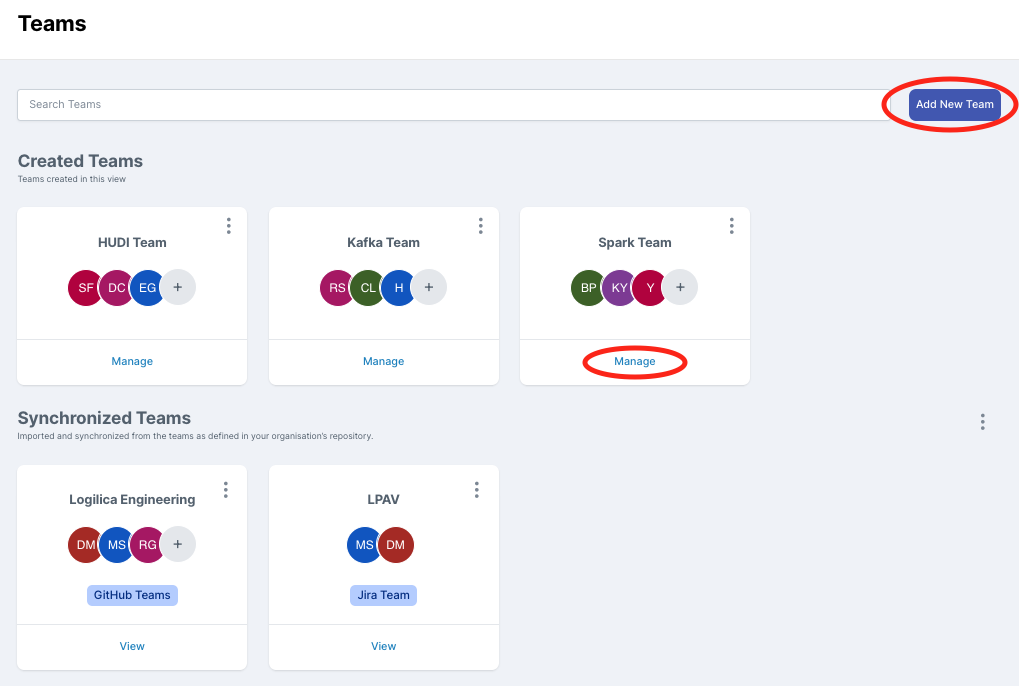
In the Teams settings, two types of teams are displayed: Synchronized Teams and Created Teams. Synchronized Teams are enabled/disabled in the respective integration connector settings. Created Teams are local to the Logilica platform, and the team, as well as its members can be managed through the Logilica interface.

<figure><img src="https://3637178088-files.gitbook.io/~/files/v0/b/gitbook-x-prod.appspot.com/o/spaces%2FvMP8keAdyp2axoLILtL5%2Fuploads%2Fgit-blob-8657b724a06b85cfcdd148bde9f05f788341a0ed%2Fadd%20team.png?alt=media" alt=""><figcaption></figcaption></figure>

You can add a new team and edit its team members.

## Creating / Managing Teams

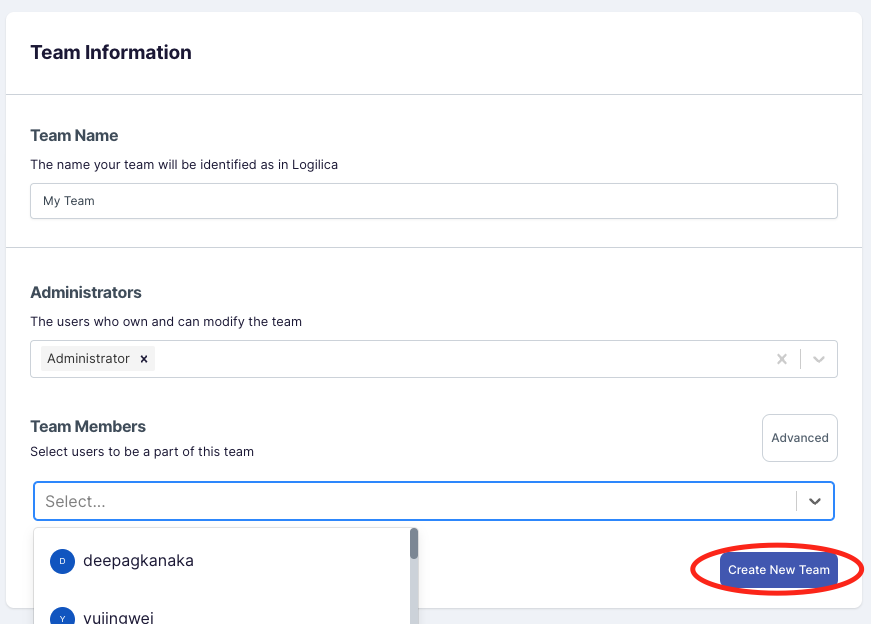
From "**Add New Team**", you can set a custom team name, assign one or more administrators who can add/remove team members, and add the team members themselves.

<figure><img src="https://3637178088-files.gitbook.io/~/files/v0/b/gitbook-x-prod.appspot.com/o/spaces%2FvMP8keAdyp2axoLILtL5%2Fuploads%2Fgit-blob-85e6a29ec3377295b440d4b2f5fc17e3d3fee1e0%2Fcreate%20team.png?alt=media" alt="" width="563"><figcaption></figcaption></figure>

After clicking "**Create New Team**", the new team will be available in the Team overview and throughout the platform for the appropriate dropdowns, filters and dashboards.


# Connecting Tools

Logilica ingests data from common DevOps and Platform Engineering products and creates out-of-the-box metrics, dashboards and reports.

To connect your data sources, navigate on the sidebar to **Settings -> Integrations**.

<figure><img src="https://3637178088-files.gitbook.io/~/files/v0/b/gitbook-x-prod.appspot.com/o/spaces%2FvMP8keAdyp2axoLILtL5%2Fuploads%2Fgit-blob-bb5620e2301c6e14cf2a3f0ba9731c75fc967339%2Fintegration%20-%20sidebar.png?alt=media" alt="" width="211"><figcaption></figcaption></figure>

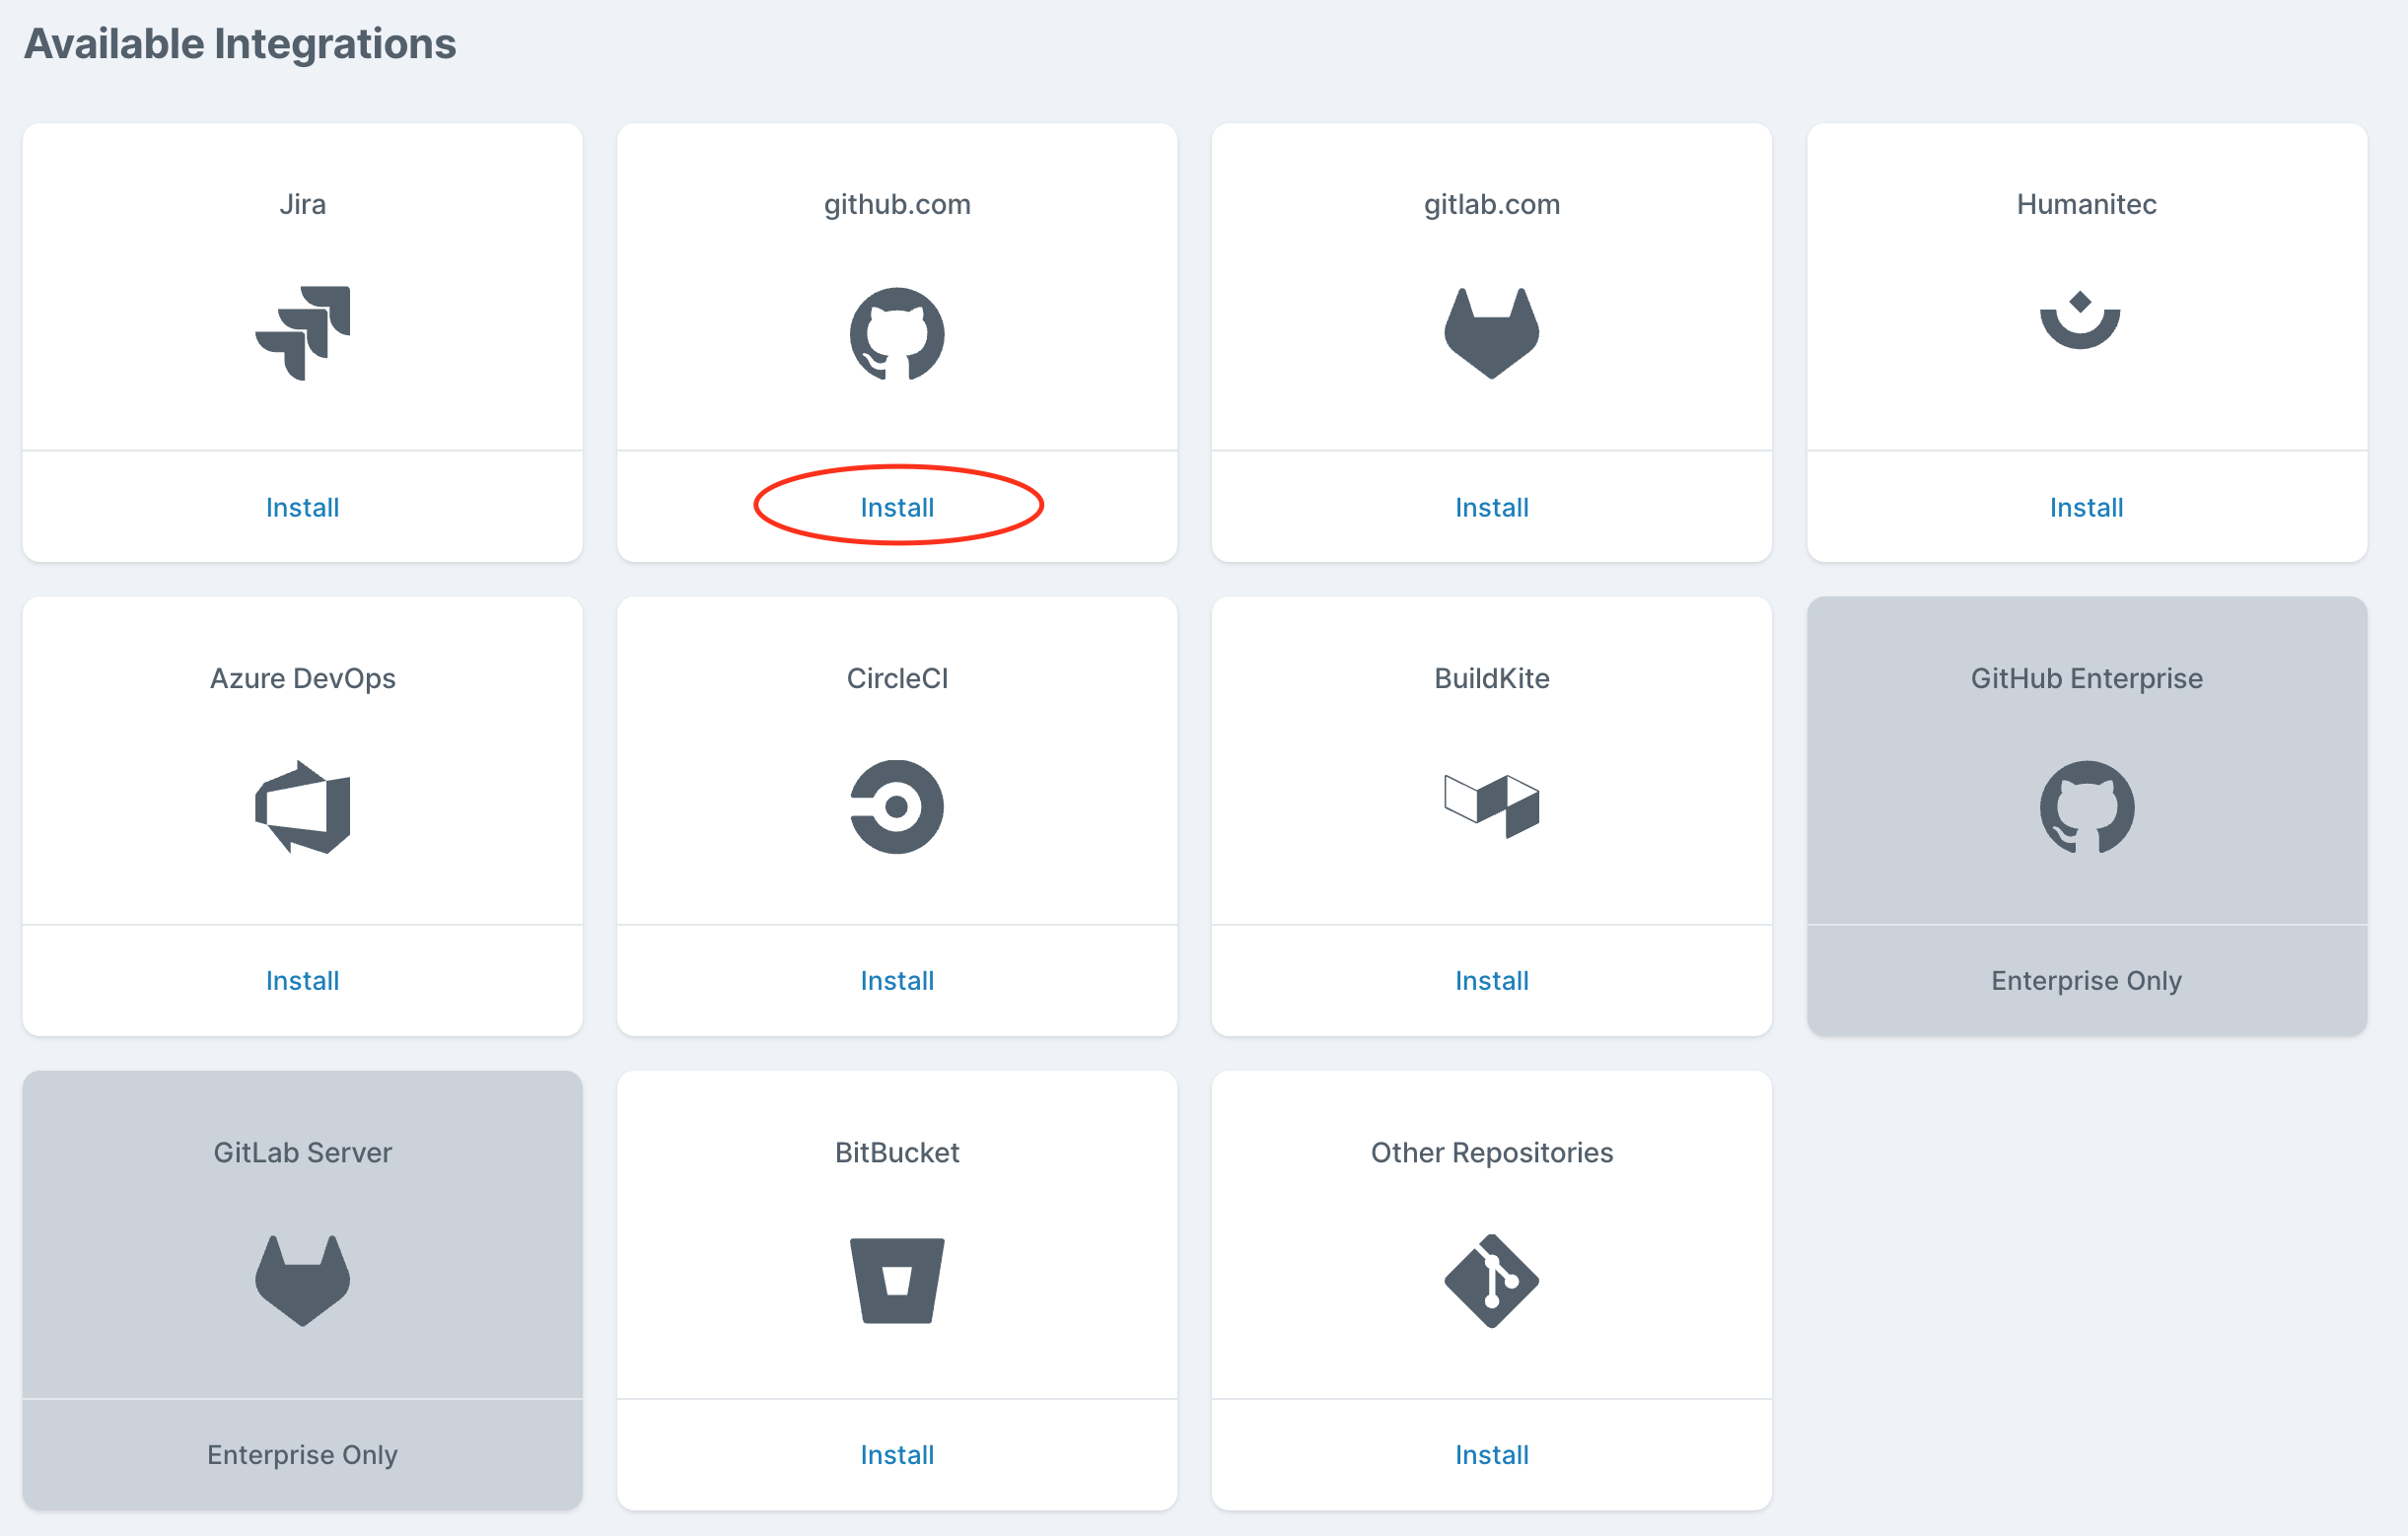
From there, select the data source you want to connect. Click **Install** to start the integration process. You will need to authenticate and allow Logilica to access the relevant metadata.

<figure><img src="https://3637178088-files.gitbook.io/~/files/v0/b/gitbook-x-prod.appspot.com/o/spaces%2FvMP8keAdyp2axoLILtL5%2Fuploads%2Fgit-blob-f54996db8f72b881d2c370f7f814fefdbf8cb312%2Fintegrations.png?alt=media" alt=""><figcaption></figcaption></figure>

## Supported Connectors

Each connector has its own page covering authentication, exactly what data is imported, how it is mapped into Logilica's model, and the configuration a customer needs to get right. Select a platform below for the detail.

### Source Code Management

| Platform                                                                   | Authentication                       | Data Imported                                                                                                    |
| -------------------------------------------------------------------------- | ------------------------------------ | ---------------------------------------------------------------------------------------------------------------- |
| [**GitHub**](/integration/connecting-tools/github)                         | OAuth or Personal Access Token (PAT) | Pull requests, commits, PR reviews and comments, PR state (open/merged/closed), releases, contributor identities |
| [**GitHub Apps**](/integration/connecting-tools/github)                    | GitHub App installation              | Same as GitHub PAT — supports enterprise and self-hosted GitHub via custom URL                                   |
| [**GitLab**](/integration/connecting-tools/gitlab) (cloud and self-hosted) | Personal Access Token                | Merge requests, commits, MR discussions/notes, approvals, releases, contributor identities                       |
| [**Azure DevOps**](/integration/connecting-tools/azure-devops)             | OAuth                                | Pull requests, commits, PR reviews and comments, PR state                                                        |
| [**Bitbucket**](/integration/connecting-tools/bitbucket)                   | OAuth                                | Pull requests, commits, PR reviews and comments, PR state                                                        |

All code connectors also import **contributor identities** (name, email, username) for identity resolution and team assignment. Logilica also links pull requests to planning tickets — see [Linking Pull Requests and Tickets](/integration/linking-pull-requests-and-tickets).

### Issue Tracking / Project Management

| Platform                                                                     | Authentication                | Data Imported                                                                                                                                                 |
| ---------------------------------------------------------------------------- | ----------------------------- | ------------------------------------------------------------------------------------------------------------------------------------------------------------- |
| [**Jira**](/integration/connecting-tools/jira) (Cloud and Server 8.x+)       | OAuth or API Token            | Issues, sprints, epics, issue events (created/assigned/in-progress/resolved), story points, custom fields, labels, issue type hierarchy, assignees, reporters |
| [**Azure DevOps Boards**](/integration/connecting-tools/azure-devops-boards) | Personal Access Token         | Work items, iterations (sprints), custom fields, work item type icons, assignees                                                                              |
| [**GitLab Issues**](/integration/connecting-tools/gitlab-issues)             | Same as GitLab code connector | Issues, epics, milestones/iterations, labels, assignees                                                                                                       |
| [**GitHub Projects**](/integration/connecting-tools/github-projects)         | Same as GitHub code connector | GitHub Projects v2 items, custom fields (priority, story points, sprint), issue events, parent/sub-issue relationships                                        |
| [**YouTrack**](/integration/connecting-tools/youtrack)                       | Permanent Token               | Issues, sprints, state history, assignee events, custom fields, labels, story points, issue type hierarchy                                                    |

### CI/CD

| Platform                                                               | How It Connects                                       | Data Imported                                                  |
| ---------------------------------------------------------------------- | ----------------------------------------------------- | -------------------------------------------------------------- |
| [**GitHub Actions**](/integration/connecting-tools/github-actions)     | Enabled via the GitHub/GitHub Apps connector settings | Workflow runs, jobs, steps, build status, start/end timestamps |
| [**GitLab Pipelines**](/integration/connecting-tools/gitlab-pipelines) | Enabled via the GitLab connector settings             | Pipelines, stages, jobs, status, timestamps                    |
| [**CircleCI**](/integration/connecting-tools/circleci)                 | API Token                                             | Builds, stages, jobs, status                                   |
| [**Buildkite**](/integration/connecting-tools/buildkite)               | API Token                                             | Pipelines, build stages, status                                |

CI/CD data feeds the [Build](/metrics-and-reports/build) dashboards and is required for [DORA metrics](/configuration/dora-configuration).

### Code Coverage

| Platform                                             | Authentication | Data Imported                                                                                                         |
| ---------------------------------------------------- | -------------- | --------------------------------------------------------------------------------------------------------------------- |
| [**Codecov**](/integration/connecting-tools/codecov) | API Token      | Per-commit coverage data, individual test results (pass/fail/skip/error), test duration, branch, contributor identity |

### AI Developer Tools

| Platform                                                                 | Authentication                                        | Data Imported                                                                                                                                                                                                                         |
| ------------------------------------------------------------------------ | ----------------------------------------------------- | ------------------------------------------------------------------------------------------------------------------------------------------------------------------------------------------------------------------------------------- |
| [**Cursor**](/integration/connecting-tools/cursor)                       | API Token                                             | Daily AI usage per user: lines added/deleted by AI, interaction types (composer, chat, agent, tab completions, command palette), request types, spend data (token counts)                                                             |
| [**Claude Code**](/integration/connecting-tools/claude-code) (Anthropic) | Admin API Token                                       | Daily AI usage per user: lines added/deleted by AI, sessions, commits and PRs created by Claude Code, tool action accepts/rejects, token counts, estimated cost, most-used model                                                      |
| [**GitHub Copilot**](/integration/connecting-tools/github-copilot)       | Enabled via the GitHub/GitHub Apps connector settings | Organisation-level and per-team Copilot metrics, interaction types, usage counts. Data is aggregated — individual per-user usage breakdowns are not available from the Copilot API. Import window is the last 100 days (not 6 months) |

AI developer tool data feeds the **AI Coding** workstream dashboard.

### Deployment Platforms

| Platform                                                 | Authentication | Data Imported                                                     |
| -------------------------------------------------------- | -------------- | ----------------------------------------------------------------- |
| [**Humanitec**](/integration/connecting-tools/humanitec) | API Token      | Applications, environments, environment types, deployments, users |

### Security Findings (SARIF Upload)

Logilica accepts security scan results via **SARIF file upload** from your CI/CD pipeline. Any scanner that emits SARIF format is supported — including Snyk, Coverity, CodeQL, AppInspector, and others. Push SARIF files to Logilica's upload API endpoint from your CI pipeline. See [Security Findings (SARIF)](/integration/connecting-tools/sarif) for the upload format and field mapping.

See the [Import API](/advanced/import) for details on uploading SARIF data via the API.

## Authentication Methods

Logilica supports two authentication approaches depending on the data provider:

### OAuth-based Access

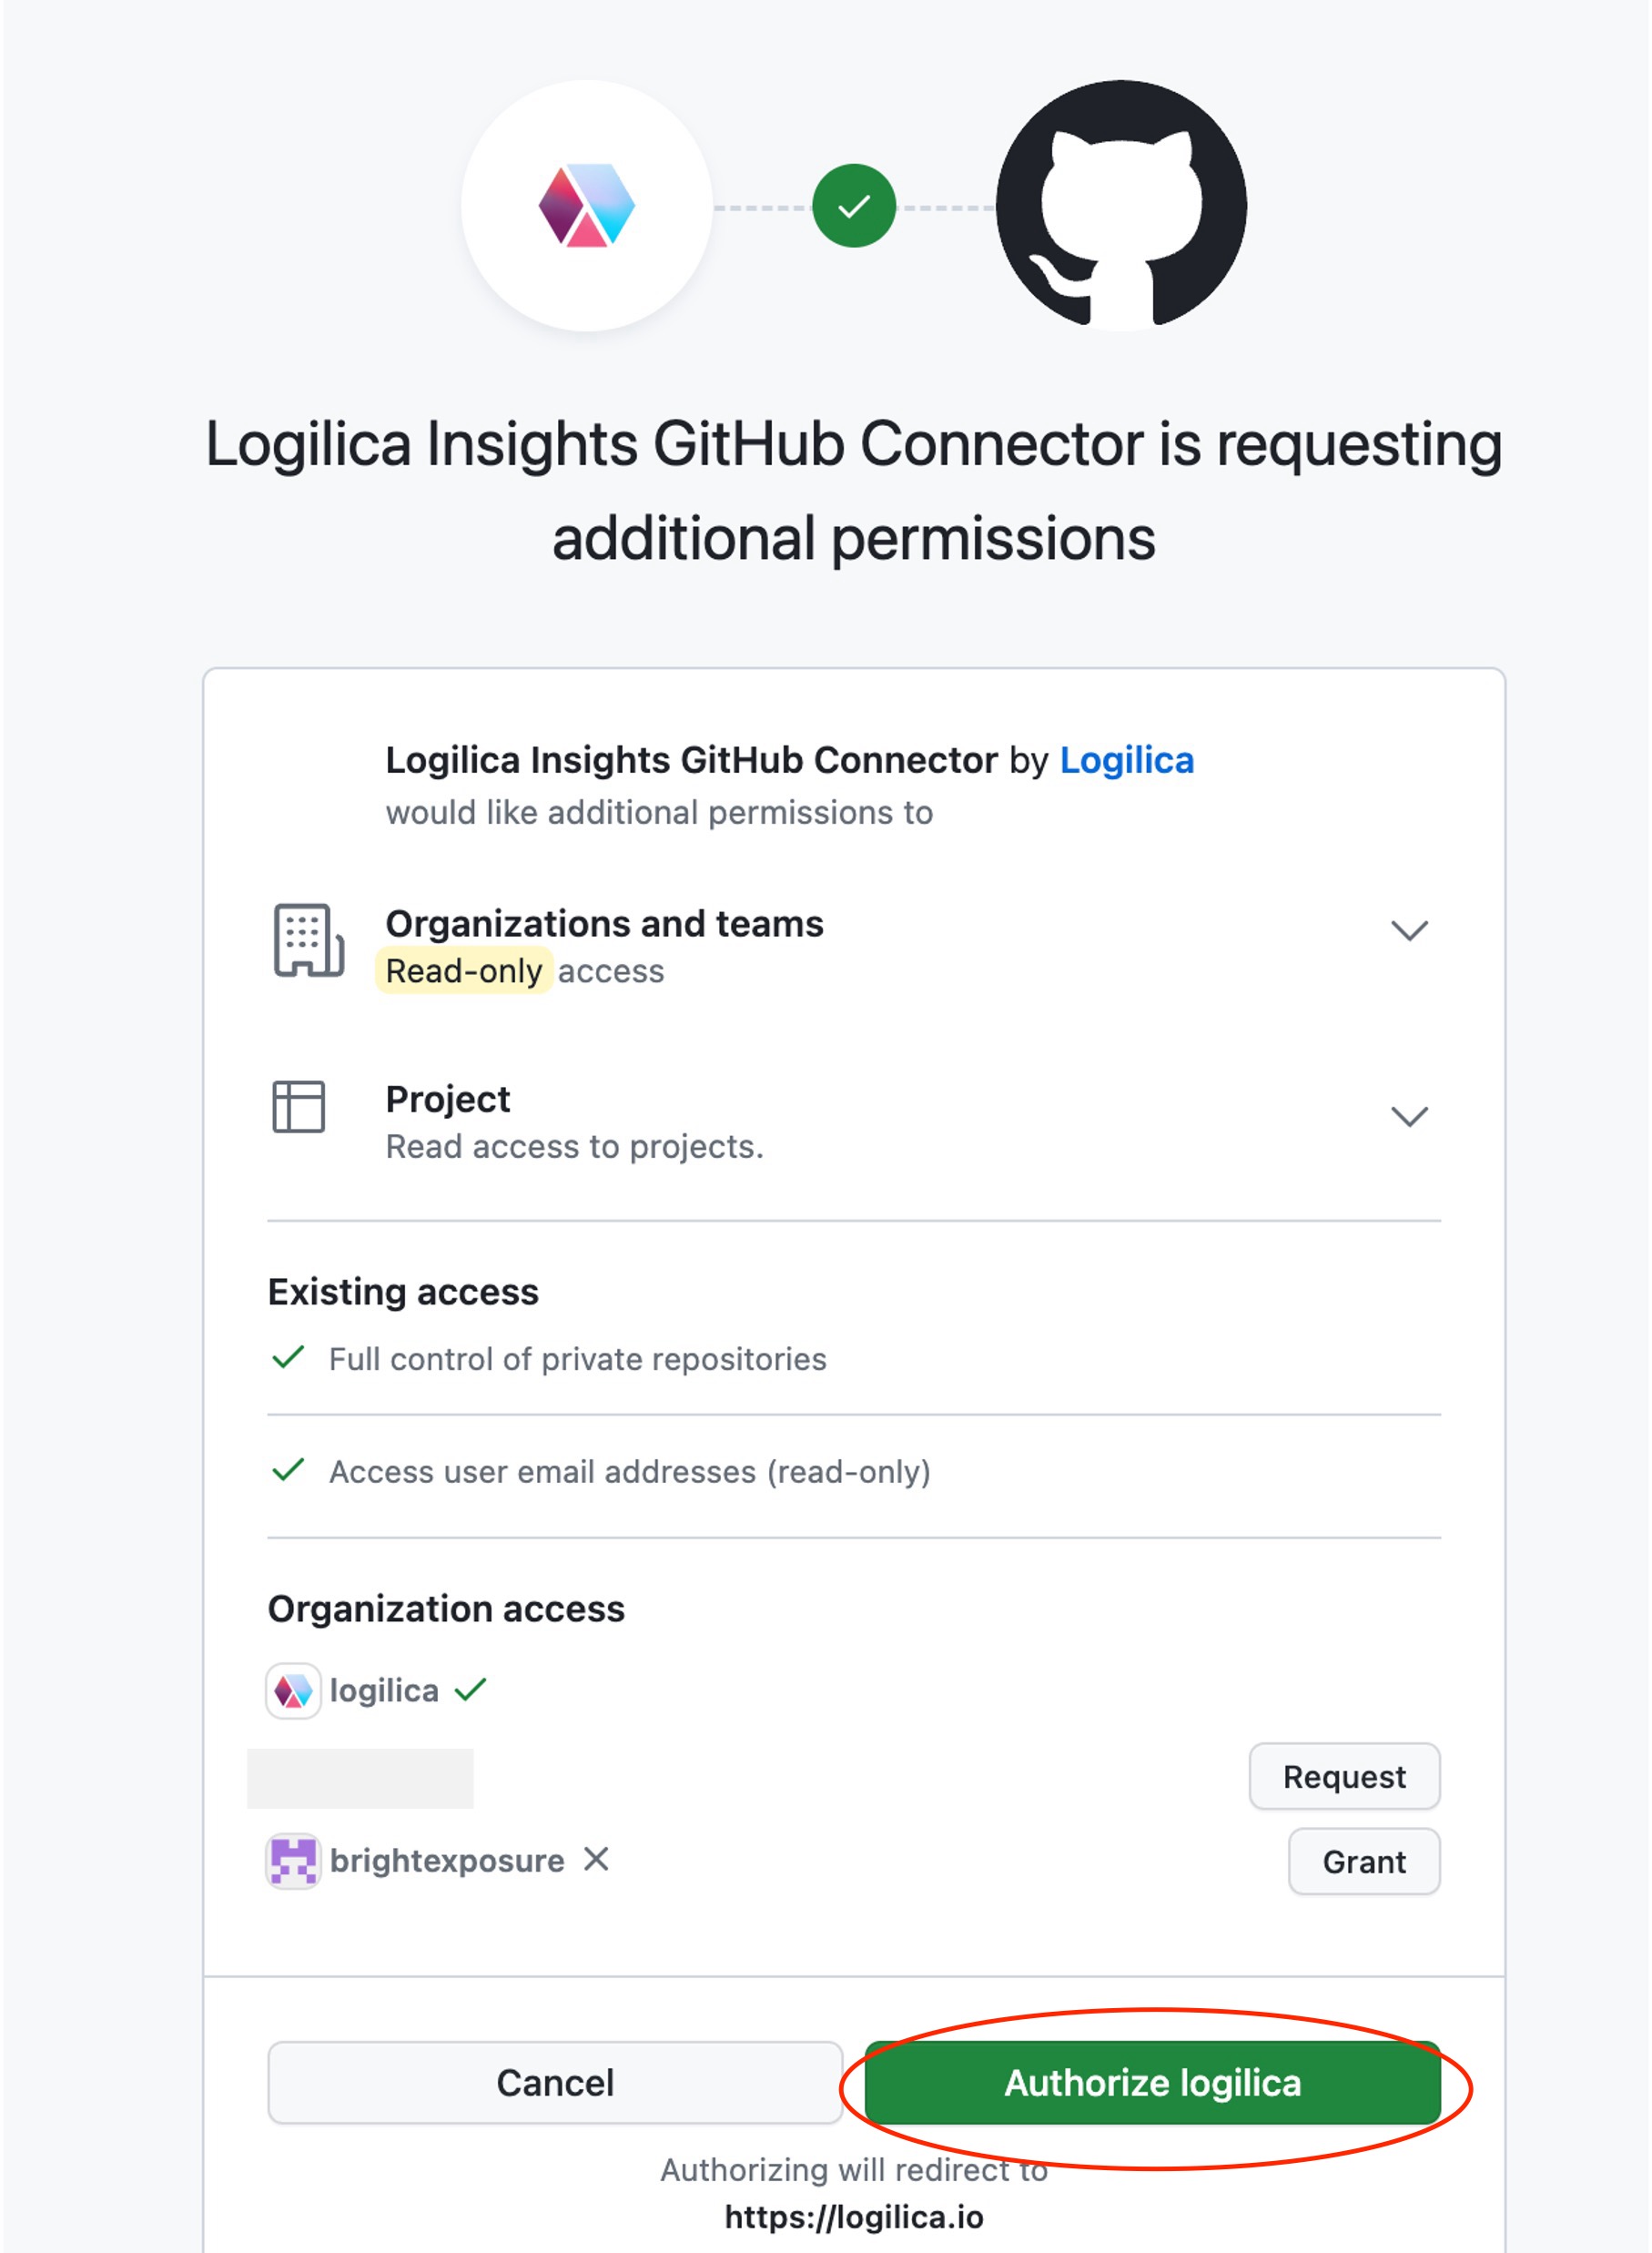
<figure><img src="https://3637178088-files.gitbook.io/~/files/v0/b/gitbook-x-prod.appspot.com/o/spaces%2FvMP8keAdyp2axoLILtL5%2Fuploads%2Fgit-blob-5f7df4a785e8fc832c3277718900261a09f49218%2Fintegration%20-%20OAuth-1.jpg?alt=media" alt="" width="375"><figcaption><p>Example of OAuth authentication</p></figcaption></figure>

Logilica will only read the relevant data and will have no write access to your data source. All OAuth authentication is done through your data provider without Logilica storing any passwords.

### Token-Based Access

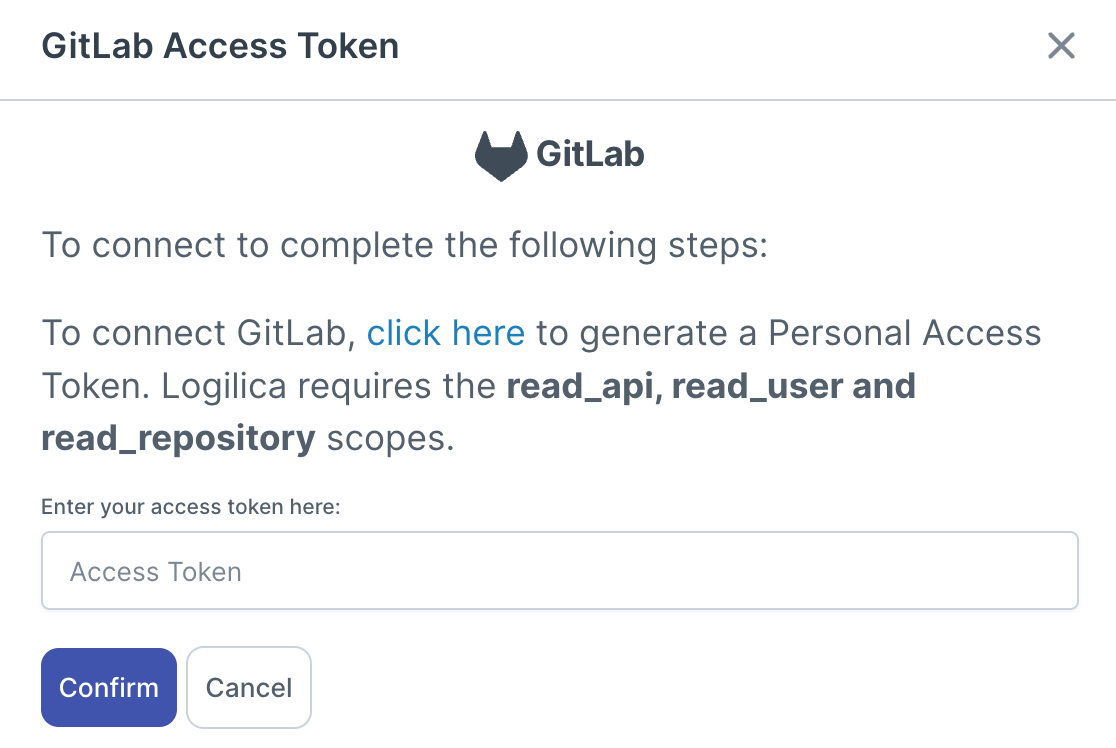
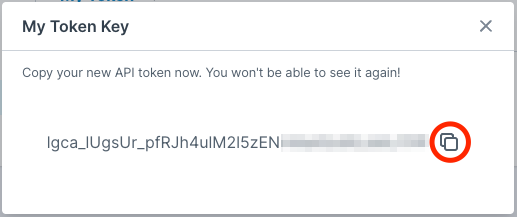
<figure><img src="https://3637178088-files.gitbook.io/~/files/v0/b/gitbook-x-prod.appspot.com/o/spaces%2FvMP8keAdyp2axoLILtL5%2Fuploads%2Fgit-blob-5ac98d9ea86c06de9615aaa2abcdb86d5c87c921%2Fintegration%20-%20token.png?alt=media" alt="" width="375"><figcaption></figcaption></figure>

Logilica supports access tokens where the data provider does not support OAuth or where additional token-based access is required.

## Connector Settings

Some connectors have additional settings that control what data is imported. For example, GitHub and GitLab connectors include toggles for:

* **Build information** — import CI/CD data (GitHub Actions, GitLab Pipelines)
* **AI usage data** — import GitHub Copilot metrics
* **Code scanning** — import SARIF security findings
* **Team synchronization** — sync platform teams as Logilica teams

These settings are available on the connector's configuration page after installation.

## Good to Know

* **First import covers the last 6 months.** Only data updated within the last 6 months is imported on the first scan. Older data that hasn't been touched won't appear. Importing data older than 6 months requires a configuration change by Logilica — contact support.
* **CI build history imports the last 1000 runs** per repository at initial onboarding. Future runs are added automatically.
* **Issue tracker connectors share a common data model.** Regardless of whether you use Jira, GitHub Projects, Azure DevOps Boards, GitLab Issues, or YouTrack, Logilica maps all planning data into a unified model with consistent state categorisation (To Do, In Progress, Done). See each issue tracker's connector page above for its platform-specific mapping rules.

## Questions?

If you cannot find your preferred data source or have trouble connecting, reach out to us at <support@logilica.com> as we may support additional data sources as part of our enterprise plan or in closed beta.


# GitHub

The GitHub connector imports pull requests, commits, code reviews and releases so your delivery, review and DORA metrics reflect what actually happens in your repositories.

## Authentication

Logilica connects to GitHub in one of three ways:

* **OAuth** — authorise Logilica through GitHub's standard consent screen. Logilica only reads the relevant data and never stores your password.
* **Personal Access Token (PAT)** — supply a token where OAuth is not available or where token-based access is preferred. The token needs the `repo`, `user:read`, and `user:email` scopes.
* **GitHub App installation** — install the Logilica GitHub App on your organisation. This is the recommended option for organisation-wide access and for **GitHub Enterprise** and **self-hosted GitHub**.

For self-hosted or Enterprise GitHub, provide your instance URL when installing the connector. Logilica routes all API calls to your instance instead of public GitHub.

See [Connecting Tools](/integration/connecting-tools) for the general installation flow.

## What's Imported

For each connected repository, Logilica imports:

* **Pull requests** — title, description, author, branch names, created/updated/closed/merged timestamps and the merger
* **Commits** on each pull request, including author, committer, commit message and authored/committed times
* **Pull request reviews** — reviewer, submission time, the review outcome, and the files each review touched
* **Releases** — name, tag, target commit, author and publish date (see [How Logilica Maps the Data](#how-logilica-maps-the-data))
* **Contributor identities** — name, email and username for every author, reviewer and merger.

When the connector is installed against an organisation, Logilica also discovers all organisation members and creates contributor identities for them, not only the people who appear directly on pull requests.

{% hint style="info" %}
Optional connector settings add **GitHub Actions** build data, **GitHub Copilot** usage data and **team synchronisation**. These are toggled on the connector's configuration page after installation. See [Connecting Tools](/integration/connecting-tools#connector-settings).
{% endhint %}

## How Logilica Maps the Data

### Pull request state

Logilica tracks each pull request through its lifecycle — open, reviewed, approved, merged or closed — combining GitHub's status with review activity. These states feed the review and delivery metrics.

### Review lifecycle

Logilica captures who reviewed each pull request, which files they reviewed, approvals, and review timing. A pull request author's reviews on their own pull request are not counted as review activity.

### Release detection

Logilica detects releases two ways, controlled by your [Release Detection](/configuration/release-detection) settings:

* **GitHub Releases** — when release detection is set to use repository releases, Logilica imports published releases directly from GitHub, including the tag, target commit and author.
* **Pull request patterns** — Logilica can also treat pull requests whose title matches your configured release pattern as releases.

Release data feeds [DORA metrics](/configuration/dora-configuration) and the [Build dashboard](/metrics-and-reports/build).

### Linking pull requests to tickets

Logilica recognises issue keys in commit messages, pull request titles and branch names to connect code changes to planning work. See [Linking Pull Requests and Tickets](/integration/linking-pull-requests-and-tickets) for how this works and how to format references.

## Good to Know

* **Kept in sync automatically.** After the initial import, Logilica refreshes this connection on a regular schedule — you don't need to re-trigger imports.
* **First import covers the last 6 months.** Only pull requests updated in the last 6 months are imported on the first scan. Pull requests created more than 6 months ago that are already closed are skipped even if recently touched. Importing older history requires a configuration change by Logilica — contact support.
* **Self-hosted and Enterprise GitHub are supported** via the GitHub App installation with a custom instance URL.
* **Commit timing handles cherry-picks.** Logilica chooses commit timestamps so cherry-picked commits don't distort your statistics.
* **Review comments are counted, not stored verbatim.** Logilica records which files were reviewed and the number of comments, but does not retain the comment text.


# GitLab

The GitLab connector imports merge requests, commits, review activity and releases from GitLab.com and self-hosted GitLab so your delivery, review and DORA metrics reflect real repository activity.

## Authentication

Logilica connects to GitLab using a **Personal Access Token** with read access to the projects you want to import. The token needs the `read_api`, `read_user`, and `read_repository` scopes (read-only). The same connector works for both **GitLab.com** and **self-hosted GitLab** — provide your instance host when installing the connector and Logilica routes all API calls to it.

See [Connecting Tools](/integration/connecting-tools) for the general installation flow.

## What's Imported

For each connected project, Logilica imports:

* **Merge requests** — title, description, author, source/target branch, created/updated/closed/merged timestamps and the merger
* **Commits** on each merge request, including author, message and authored/committed times
* **Notes and discussions** — comments and diff-line discussions
* **Approvals** — who approved and how many approvals are still required
* **Releases** — name, tag, target commit, author and publish date (see [How Logilica Maps the Data](#how-logilica-maps-the-data))
* **Contributor identities** — username, name and public email for every author, reviewer and merger

{% hint style="info" %}
Optional connector settings add **GitLab Pipelines** build data and **team (group) synchronisation**. These are toggled on the connector's configuration page after installation. See [Connecting Tools](/integration/connecting-tools#connector-settings).
{% endhint %}

## How Logilica Maps the Data

### Merge request state

Logilica tracks each merge request through its lifecycle — open, reviewed, approved, merged or closed — combining GitLab's status with review activity.

### Review lifecycle

Logilica captures who reviewed each merge request, which files they reviewed, approvals, and review timing from GitLab's comments and approval feature.

{% hint style="info" %}
On GitLab, approval status comes from GitLab's approval feature rather than from review comments. The "changes requested" detail available on GitHub is not available for GitLab.
{% endhint %}

### Release detection

Logilica detects releases two ways, controlled by your [Release Detection](/configuration/release-detection) settings:

* **GitLab Releases** — when release detection is set to use repository releases, Logilica imports releases directly from GitLab, including the tag, commit and author.
* **Merge request patterns** — Logilica can also treat merge requests whose title matches your configured release pattern as releases.

Release data feeds [DORA metrics](/configuration/dora-configuration) and the [Build dashboard](/metrics-and-reports/build).

### Linking merge requests to tickets

Logilica recognises issue keys in commit messages, merge request titles and branch names to connect code changes to planning work. See [Linking Pull Requests and Tickets](/integration/linking-pull-requests-and-tickets) for how this works and how to format references.

## Good to Know

* **Kept in sync automatically.** After the initial import, Logilica refreshes this connection on a regular schedule — you don't need to re-trigger imports.
* **First import covers the last 6 months.** Only merge requests updated in the last 6 months are imported on the first scan. Merge requests created more than 6 months ago that are already closed or merged are skipped. Importing older history requires a configuration change by Logilica — contact support.
* **Merge requests with no commits are skipped.**
* **Close timestamps can be approximate on self-hosted GitLab.** Where GitLab does not report a close time, Logilica uses an approximate time instead.
* **Comments are counted, not stored verbatim.** Logilica records comment counts and which files were reviewed, but does not retain comment text.


# Azure DevOps

The Azure DevOps connector imports pull requests, commits and code review activity from your Azure DevOps Git repositories so your delivery and review metrics reflect real repository activity.

{% hint style="info" %}
This page covers the **Azure DevOps source code (Repos)** connector — pull requests, commits and reviews. Work items, iterations and other planning data come from the separate **Azure DevOps Boards** connector.
{% endhint %}

## Authentication

Logilica connects to Azure DevOps using **OAuth**. Authorise Logilica through Azure DevOps and Logilica reads your repository data using the granted access token. Logilica only reads the relevant data and never stores your password.

**Prerequisite:** your organisation must allow third-party application access via OAuth (**Organization Settings > Policies > Application connection policies**).

See [Connecting Tools](/integration/connecting-tools) for the general installation flow.

## What's Imported

For each connected repository, Logilica imports:

* **Pull requests** — title, description, author, source/target branch, created and closed timestamps, and the merger
* **Commits** on each pull request, including author, committer, commit message and authored/committed times
* **Comments and review threads** — including the files inline comments apply to
* **Approval votes** — who approved and when
* **Changed-file counts** — the number of files changed in the pull request
* **Contributor identities** — display name and email for every author, reviewer, committer and merger, used for identity resolution and team assignment

## How Logilica Maps the Data

### Pull request state

Logilica tracks each pull request through its lifecycle — open, reviewed, approved, merged or closed — combining Azure DevOps status with review activity.

### Review lifecycle

Logilica captures who reviewed each pull request, which files they reviewed, approvals, and review timing from Azure DevOps comment threads and approval votes.

### Linking pull requests to tickets

Logilica recognises issue keys in commit messages, pull request titles and branch names to connect code changes to planning work. See [Linking Pull Requests and Tickets](/integration/linking-pull-requests-and-tickets) for how this works and how to format references.

## Good to Know

* **Kept in sync automatically.** After the initial import, Logilica refreshes this connection on a regular schedule — you don't need to re-trigger imports.
* **Releases are not imported from this connector.** Release detection for DORA on Azure DevOps relies on other sources such as build data or pull request patterns. See [Release Detection](/configuration/release-detection) and [DORA Configuration](/configuration/dora-configuration).
* **Comments are used for metrics, not stored verbatim.** Logilica records reviewers and which files were reviewed.
* **Build data is not yet imported by this connector.** CI/CD metrics on Azure DevOps come from separately supported build sources — see [Connecting Tools](/integration/connecting-tools) and the [Build dashboard](/metrics-and-reports/build).


# Bitbucket

The Bitbucket connector imports pull requests, commits and code review activity from Bitbucket Cloud so your delivery and review metrics reflect real repository activity.

## Authentication

Logilica connects to Bitbucket using **OAuth**. Authorise Logilica through Bitbucket and Logilica reads your repository data using the granted access token. Logilica only reads the relevant data and never stores your password. Logilica requests read-only access to your Bitbucket Cloud workspaces.

See [Connecting Tools](/integration/connecting-tools) for the general installation flow.

## What's Imported

For each connected repository, Logilica imports:

* **Pull requests** — title, description, author, source branch, created/updated/closed timestamps, and who closed (merged) the pull request
* **Commits** on each pull request, including author, commit message and commit time
* **Comments and inline comments** — including the file an inline comment applies to
* **Approvals** — who approved and when
* **Changed-file counts** — the number of files changed in the pull request
* **Contributor identities** — display name and account for every author, reviewer and merger, used for identity resolution and team assignment

## How Logilica Maps the Data

### Pull request state

Logilica tracks each pull request through its lifecycle — open, reviewed, approved, merged or declined — combining Bitbucket's status with review activity.

### Review lifecycle

Logilica captures who reviewed each pull request, which files they reviewed, approvals, and review timing from Bitbucket's comments and approval events.

### Linking pull requests to tickets

Logilica recognises issue keys in commit messages, pull request titles and branch names to connect code changes to planning work. See [Linking Pull Requests and Tickets](/integration/linking-pull-requests-and-tickets) for how this works and how to format references.

## Good to Know

* **Kept in sync automatically.** After the initial import, Logilica refreshes this connection on a regular schedule — you don't need to re-trigger imports.
* **First import covers the last 6 months.** Only pull requests updated in the last 6 months are imported on the first scan. Importing older history requires a configuration change by Logilica — contact support.
* **Bitbucket does not expose user email addresses**, so contributor identities are matched on display name and account rather than email. This can affect identity resolution where the same person uses different accounts.
* **Bitbucket has no draft pull requests**, so no pull request is imported as a draft.
* **Releases are not imported from this connector.** Release detection for DORA on Bitbucket relies on other sources such as build data or pull request patterns. See [Release Detection](/configuration/release-detection) and [DORA Configuration](/configuration/dora-configuration).
* **Comments are counted, not stored verbatim.** Logilica records comment counts, reviewers and which files were reviewed for metrics.


# Jira

This guide covers how Logilica imports issues, epics, sprints, and history from Jira, and the field and issue-type configuration that ensures your planning data is recognised and categorised correctly. Logilica supports both Jira Cloud and Jira Server (Data Center) 8.x and above.

## Authentication

Logilica connects to Jira in one of two ways, depending on your hosting:

* **Jira Cloud** — OAuth, or an API token. With OAuth, Logilica reads only the data it needs and never gains write access, and your password is never stored.
* **Jira Server / Data Center** — basic authentication or a personal API token.

See [Connecting Tools](/integration/connecting-tools) for the general installation and authentication flow.

## What's Imported

For each Jira project you connect, Logilica imports:

* **Issues** — summary, description, type, status, priority, labels, components, resolution, due date, created/updated/resolved dates, and time tracking (original estimate, remaining estimate, time spent)
* **Epics and the full parent hierarchy** — including epics and higher-level issues that sit outside the connected project (these are fetched separately so the hierarchy stays complete)
* **Subtasks** and parent/child relationships, including the complete ancestor chain
* **Sprints** — name, state, start, end, and completion dates, plus goal
* **Releases** (fix versions and affected versions)
* **Issue history** — status changes, assignments, resolution, and sprint changes
* **Story point estimates**
* **Custom fields** — every custom field present on an issue is imported alongside the built-in fields
* **Assignees, reporters, creators, and resolvers** — user identity, name, and email
* **Labels** and **components**
* **Linked pull requests** — see [Linking Pull Requests and Tickets](/integration/linking-pull-requests-and-tickets)

{% hint style="info" %}
If your issue descriptions contain sensitive content, you can exclude them after installation with the **Ignore Ticket Description** toggle under **Import Configuration** on the connector page.
{% endhint %}

## Issue State Mapping

Logilica categorises every issue into **To Do**, **In Progress**, or **Done**. For Jira, this categorisation is driven by the issue's **Status Category** — the grouping Jira assigns to every status — not the status name itself.

Jira's three status categories map directly onto Logilica's categories:

| Jira Status Category | Logilica Category |
| -------------------- | ----------------- |
| `To Do`              | **To Do**         |
| `In Progress`        | **In Progress**   |
| `Done`               | **Done**          |

Because Logilica reads the status category rather than the status name, custom statuses are handled automatically — a status named `In Review`, `QA`, or `Deployed` is categorised correctly as long as it is assigned to the right status category in Jira.

{% hint style="info" %}
Every Jira status belongs to one of the three categories above, and Jira sets this when you create a status. If a custom status is categorised incorrectly in Logilica, check that the status is assigned to the correct status category in your Jira workflow settings (**Project settings > Statuses**).
{% endhint %}

## Field & Type Configuration

Logilica detects the following fields by their **exact, case-sensitive Jira field name**. These are Jira's standard field names, so no action is needed unless your instance has renamed them:

| Jira Field Name | Used For                                           |
| --------------- | -------------------------------------------------- |
| `Sprint`        | Sprint membership and sprint-change history        |
| `Story Points`  | Story point estimates                              |
| `Epic Link`     | Parent epic on classic (company-managed) projects  |
| `Parent Link`   | Parent linkage on Jira Premium (advanced roadmaps) |

{% hint style="warning" %}
These names are matched exactly. If your Jira administrator has renamed the `Sprint`, `Story Points`, `Epic Link`, or `Parent Link` field, the corresponding data will not be imported until the original name is restored. Variations such as `Story Point`, `Sprints`, or `SP` are not recognised.
{% endhint %}

### Parent and epic detection

Logilica links each issue to its parent using the issue's **parent** field (team-managed / next-gen projects), `Epic Link` (classic projects), or `Parent Link` (Jira Premium with advanced roadmaps enabled). On plans without advanced roadmaps, `Parent Link` carries no value and is ignored.

### Issue-type hierarchy

Logilica organises issues into a hierarchy using Jira's own issue-type levels:

* Issue types **above Epic** (such as Initiative) are treated as initiatives at the top of the hierarchy.
* **Epics** are grouped as epics.
* Standard types such as `Story`, `Task`, and `Bug` are treated as regular issues.
* **Subtasks** are treated as subtasks.

An issue type named `Epic` is always treated as an epic.

{% hint style="info" %}
If your team uses custom issue types **above** the Epic level (for example a custom `Theme` or `Outcome` type) and they are not being treated as initiatives automatically, contact your Logilica administrator. These can be added to the connector's configuration so they are recognised as higher-than-epic types — this is not something you can change from the connector page.
{% endhint %}

## Good to Know

* **Kept in sync automatically.** After the initial import, Logilica refreshes this connection on a regular schedule — you don't need to re-trigger imports.
* **First import covers the last 6 months.** Only issues updated within the last 6 months are imported on the first scan. Older issues that haven't been touched won't appear. Importing data older than 6 months requires a configuration change by Logilica — contact support.
* **Epics are always fully imported.** Even when a parent epic was last updated more than 6 months ago, or lives outside the connected project, Logilica fetches it so the issue hierarchy remains complete.
* **Field names are case-sensitive.** Status *categories* are matched by Jira's own category, so custom status names are safe, but the `Sprint`, `Story Points`, `Epic Link`, and `Parent Link` field names must match exactly.
* **Comments, attachments, and individual work-log entries are not imported.** Aggregated time tracking (original estimate, remaining estimate, time spent) is imported, but individual time-log entries and comments are not.


# Azure DevOps Boards

This guide covers how Logilica imports work items, iterations, and history from Azure DevOps Boards, and how work item states and types are categorised. It applies to the Boards (work tracking) side of Azure DevOps; pull requests and commits are handled by the separate Azure DevOps code connector.

## Authentication

Logilica connects to Azure DevOps Boards using **OAuth** — you authorise Logilica from Azure DevOps rather than supplying a token. Make sure your organisation allows third-party application access via OAuth (**Organization Settings > Policies > Application connection policies**). Logilica reads only the data it needs and never gains write access. See [Connecting Tools](/integration/connecting-tools) for the installation flow.

## What's Imported

For each Azure DevOps project you connect, Logilica imports:

* **Work items** — title, description, state, type, priority, tags, target/due date, created/changed/closed dates, and the close reason
* **Parent and child links** — work items linked by `Parent` and `Child` relationships
* **Iterations** — name, time frame (past / current / future), start and finish dates, mapped to Logilica sprints
* **Work item history** — state changes and assignment changes
* **Story point estimates** — taken from the work item **Effort** field
* **Custom fields** — every custom field defined on the project is imported alongside the built-in fields
* **Work item type icons**
* **Tags** — imported as labels
* **Assignees, creators, and resolvers** — user identity, display name, and email (the creator and reporter are the same person for Azure DevOps work items)
* **Linked pull requests** — see [Linking Pull Requests and Tickets](/integration/linking-pull-requests-and-tickets)

{% hint style="info" %}
If your work item descriptions contain sensitive content, you can exclude them after installation with the **Ignore Ticket Description** toggle under **Import Configuration** on the connector page.
{% endhint %}

## Issue State Mapping

Logilica categorises every work item into **To Do**, **In Progress**, or **Done** based on its **State** field. The match is **case-insensitive**:

| Work Item State | Logilica Category |
| --------------- | ----------------- |
| `Done`          | **Done**          |
| `To Do`         | **To Do**         |
| `New`           | **To Do**         |
| `In Progress`   | **In Progress**   |
| `Doing`         | **In Progress**   |
| Any other state | **In Progress**   |

{% hint style="warning" %}
Only `Done`, `To Do`, and `New` map to a non-default category. Every other state — including custom states such as `Approved`, `Committed`, `Resolved`, `Closed`, or `Removed` — falls through to **In Progress**. If your process template uses states beyond the values above and you need them categorised as Done or To Do, contact your Logilica administrator.
{% endhint %}

A work item's resolution detail is taken from its close reason, and is captured only when the state is exactly `Done`.

## Field & Type Configuration

Logilica reads the following built-in Azure DevOps work item fields automatically. These are standard system fields and require no configuration:

| Work Item Field                 | Used For                                     |
| ------------------------------- | -------------------------------------------- |
| **State**                       | Status category (To Do / In Progress / Done) |
| **Work Item Type**              | Issue type and hierarchy                     |
| **Effort**                      | Story point estimate                         |
| **Priority**                    | Issue priority                               |
| **Tags**                        | Labels                                       |
| **Target Date**                 | Due date                                     |
| **Assigned To**                 | Current assignee                             |
| **Closed By** / **Closed Date** | Resolver and resolution time                 |

### Story points

Story points are read from the **Effort** field. If your team records estimates in a different field (such as Story Points on an Agile process template), those values will not be imported as story points — move your estimates to **Effort**, or contact your Logilica administrator.

### Issue-type hierarchy

Logilica organises work items into a hierarchy from the **Work Item Type** name:

* Types named for a **feature** or **initiative** are treated as initiatives at the top of the hierarchy.
* **Epic** types are grouped as epics.
* **Subtask** types are treated as subtasks.
* Standard types such as `Task`, `Bug`, and `User Story` are treated as regular issues.

If you use custom types that should sit at the epic or initiative level, contact your Logilica administrator to have them mapped — this is not something you can change from the connector page.

## Good to Know

* **Kept in sync automatically.** After the initial import, Logilica refreshes this connection on a regular schedule — you don't need to re-trigger imports.
* **First import covers the last 6 months.** Only work items changed within the last 6 months are imported on the first scan. Older work items that haven't been touched won't appear. Importing data older than 6 months requires a configuration change by Logilica — contact support.
* **If no work items are found in the window, the import stops.** A project with no recently changed work items will be skipped.
* **No time estimates are imported.** Azure DevOps Boards work items do not carry the original/remaining estimate fields Logilica tracks for other tools, so these are recorded as zero.
* **Unrecognised states default to In Progress.** This is the single most common source of mis-categorised work items — see the State Mapping warning above.
* **Reference work items as `PROJECTNAME-1234` in branches and pull requests.** Azure DevOps shows the work item ID on its own, so add your project name and a hyphen in front of it, in uppercase.


# GitLab Issues

This guide covers how Logilica imports issues, epics, iterations, and history from GitLab, and how issue states, labels, and types are categorised. It applies to the issue-tracking side of GitLab; merge requests and commits are handled by the GitLab code connector. GitLab cloud (gitlab.com) and self-hosted instances are both supported.

## Authentication

GitLab Issues uses the **same Personal Access Token (PAT)** as the GitLab code connector — there is no separate authentication step. The token is sent as a private token on every request and grants read-only access. The shared GitLab token needs the `read_api`, `read_user`, and `read_repository` scopes. See [Connecting Tools](/integration/connecting-tools) for the installation flow.

## What's Imported

For each GitLab project you connect, Logilica imports:

* **Issues** — title, description, state, severity (used as priority), labels, due date, created/updated/closed dates, and time tracking (estimate and total time spent)
* **Epics** — imported for projects that belong to a GitLab **group** (personal projects have no epics)
* **Iterations** — name, state, goal/description, and start date, mapped to Logilica sprints
* **Issue history** — created, assigned, closed (resolved), reopened, sprint-change, and in-progress events
* **Story point estimates** — taken from the issue **weight**
* **Custom workflow labels** that represent in-progress states (see State Mapping below)
* **Labels** — both group-level and project-level labels
* **Linked merge requests** — see [Linking Pull Requests and Tickets](/integration/linking-pull-requests-and-tickets)
* **Assignees, authors (reporters), and resolvers** — user identity, name, and username (the author and reporter are the same person for GitLab issues)

{% hint style="info" %}
If your issue descriptions contain sensitive content, you can exclude them after installation with the **Ignore Ticket Description** toggle under **Import Configuration** on the connector page.
{% endhint %}

## Issue State Mapping

GitLab issues have only two native states, `opened` and `closed`, which map as follows:

| GitLab State | Logilica Category |
| ------------ | ----------------- |
| `opened`     | **To Do**         |
| `closed`     | **Done**          |

GitLab has no native **In Progress** state, so Logilica reads it from your **project board columns**. An open issue sitting in a board column other than your To Do or Done columns is categorised as **In Progress**, and its status takes that column's name.

{% hint style="info" %}
An open issue in a column named anything other than your To Do or Done columns — for example `Doing`, `In Review`, or `QA` — is categorised as **In Progress**, and its status name is set to that column's name. Matching is case-insensitive.
{% endhint %}

In practice this means:

* An `opened` issue with no in-progress workflow label stays in **To Do**.
* An `opened` issue in an in-progress board column is categorised as **In Progress**.
* A `closed` issue is always **Done**, regardless of labels.

## Field & Type Configuration

GitLab issue fields are read automatically — there are no custom field names you need to set:

| GitLab Field  | Used For                                                  |
| ------------- | --------------------------------------------------------- |
| **state**     | Base status category (`opened` / `closed`)                |
| **weight**    | Story point estimate                                      |
| **severity**  | Issue priority                                            |
| **labels**    | Labels, and in-progress categorisation from board columns |
| **iteration** | Sprint membership                                         |
| **due date**  | Due date                                                  |
| **epic**      | Parent epic linkage                                       |

### Story points

Story points come from the issue **weight**. If a team does not set weights, story point estimates will be zero.

### Issue-type hierarchy

Logilica imports two kinds of planning item from GitLab: **Issues** (treated as standard issues) and **Epics** (treated as epics). Issues are linked to their parent epic automatically. There is no deeper custom-type hierarchy — GitLab's newer custom work item types are not yet imported as distinct types.

{% hint style="info" %}
Epics live at the **group** level in GitLab. A project that is not part of a group (a personal project) has no epics, so epic import is skipped for those projects.
{% endhint %}

## Good to Know

* **Kept in sync automatically.** After the initial import, Logilica refreshes this connection on a regular schedule — you don't need to re-trigger imports.
* **First import covers the last 6 months.** Only issues, epics, and iterations updated within the last 6 months are imported on the first scan. Older items that haven't been touched won't appear. Importing data older than 6 months requires a configuration change by Logilica — contact support.
* **In Progress depends on board labels.** Without project boards whose lists use distinct workflow labels, GitLab issues only ever appear as **To Do** (open) or **Done** (closed). To see an In Progress stage, set up board columns for your in-progress states.
* **Subtasks are not imported.** GitLab issue tasks/sub-items are not yet brought in as subtasks.
* **Iterations may be unavailable.** If the connecting token cannot read iterations (for example on a plan that doesn't include them), iteration import is skipped and issues will simply have no sprint membership.


# GitHub Projects

[GitHub Projects](https://docs.github.com/en/issues/planning-and-tracking-with-projects/learning-about-projects/about-projects) is GitHub's flexible and configurable planning and task management system. Logilica supports GitHub Projects boards by importing them as **Planning data**.

Because GitHub Projects is highly customisable, a few naming conventions in your board let Logilica map your planning data correctly. These are described below.

## Authentication

GitHub Projects uses the **same access as the GitHub connector** — there is no separate authentication step. You connect GitHub once and select your Projects boards as planning data. The same authentication options apply:

* **OAuth** — authorise Logilica through GitHub's standard consent screen. This is the default way to connect GitHub.
* **Personal Access Token (PAT)** — supply a token with access to the project and its issues, for example on GitHub Enterprise or where OAuth is not available. The token needs the `repo`, `user:read`, and `user:email` scopes.
* **GitHub App installation** — install the Logilica GitHub App on your organisation. This is the recommended option for organisation-wide access and for **GitHub Enterprise** and **self-hosted GitHub**.

See [Connecting Tools](/integration/connecting-tools) for the general installation flow.

{% hint style="info" %}
Logilica imports modern **Projects v2** boards only. Classic GitHub Projects are not supported.
{% endhint %}

## What's Imported

For each GitHub Projects board you connect, Logilica imports:

* **Issues** — title, description, status, type, priority, labels, story points, and created/updated/closed dates
* **Draft issues** — title, description, status, author, and assignee (draft issues carry minimal data, so they have no labels, sprints, custom fields, or history beyond creation and assignment)
* **Issue history** — created, assigned, status-change, and closed (resolved) events from each issue's timeline
* **Sprints** — name and start/end dates, derived from a custom iteration field (see Sprints below)
* **Parent/child relationships** — sub-issues, and a parent issue when that parent is an `epic` (see Issue Types below)
* **Assignees and authors (reporters)** — user identity, name, and username (the author and reporter are the same person for GitHub Projects)
* **Linked pull requests** — see [Linking Pull Requests and Tickets](/integration/linking-pull-requests-and-tickets)
* **Custom fields** — other project fields you have added beyond the built-in ones are imported alongside each issue
* **Labels** — every label applied to imported issues

{% hint style="info" %}
If your issue descriptions contain sensitive content, you can exclude them after installation with the **Ignore Ticket Description** toggle under **Import Configuration** on the connector page.
{% endhint %}

## Issue State Mapping

Logilica categorises each item's GitHub **Status** into one of three categories:

* **To Do** — any item whose status is unset or matches `todo` or `to do`
* **In Progress** — any item whose status matches `in progress` or `in review`
* **Done** — any item whose status matches `done`

An item with no status set is recorded as `Not Set` and categorised as **To Do**.

## Field & Type Configuration

Logilica reads these values from either a [label](https://docs.github.com/en/issues/using-labels-and-milestones-to-track-work/managing-labels) or a [custom field](https://docs.github.com/en/issues/planning-and-tracking-with-projects/understanding-fields) on the issue. Unless stated otherwise, all matching is case-insensitive.

### Issue types

GitHub Project issue types are detected in two ways:

* A label on the issue that begins with `kind/` or `type/` — the text following the `/` is taken as the **issue type name**.
* The value of a custom field named either `kind` or `type` is taken as the **issue type name**.

**Note**: when both are present, the custom field takes precedence. Issues with no detected type default to `Issue`.

A parent issue is linked to its sub-issues only when the parent's type is `epic`. Sub-issues are still imported either way.

### Sprints

Logilica detects sprints through the values used in a custom [iteration field](https://docs.github.com/en/issues/planning-and-tracking-with-projects/understanding-fields/about-iteration-fields) within imported issues. The custom iteration field must be named `sprint`. Each iteration's start date and duration are used to set the sprint's start and end.

### Other fields

In addition to the above, the following fields are also supported:

* **Priority** — matches the value that appears after a label that starts with `priority/`, or a custom field on an issue named `priority`.
* **Story Points** — matches on a custom field within an issue named `story point` (the field name `story points` is also recognised).

{% hint style="info" %}
Field names are matched loosely, so a field named `story points` is recognised by the `story point` rule above.
{% endhint %}

## Best Practices

For Logilica to most accurately reflect the GitHub Projects data, we recommend following a few best practices in your GitHub Projects setup:

* Use labels or custom fields to define issue types with the convention explained [above](#issue-types).
* Use issue status such as `todo`, `in progress`, and `done` as explained [above](#issue-state-mapping).
* Make sure you are using the `iteration field` to define sprints.
* Define story points and priorities as described [above](#other-fields).

For more questions consult the GitHub Projects [documentation](https://docs.github.com/en/issues/planning-and-tracking-with-projects/learning-about-projects/about-projects) or connect with your Logilica support representative.

## Good to Know

* **Kept in sync automatically.** After the initial import, Logilica refreshes this connection on a regular schedule — you don't need to re-trigger imports.
* **First import covers the last 6 months.** Only issues updated within the last 6 months are imported on the first scan. Older issues that haven't been touched won't appear. Importing data older than 6 months requires a configuration change by Logilica — contact support.
* **Modern Projects v2 only.** Classic GitHub Projects are not imported.
* **Sprint end dates come from the iteration length.** GitHub iterations define a start date and a duration rather than an explicit end date, so a sprint's end is set from its start plus duration.
* **A single assignee is recorded.** GitHub issues can have multiple assignees, but Logilica records one — the most recent assignee from the issue's timeline (for draft issues, one of the listed assignees).


# YouTrack

This guide covers how Logilica imports issues, states, types, sprints, and history from YouTrack, and how to prepare your YouTrack instance so all your data is categorised correctly. YouTrack's flexible field system requires specific naming and configuration to ensure Logilica can recognise and categorise your data.

## Authentication

Logilica connects to your YouTrack instance using a **permanent token** issued from your YouTrack account. The permanent token needs the `YouTrack` scope.

Along with the token, enter your YouTrack **service URL**, in one of these forms: `example.youtrack.cloud` or `example.myjetbrains.com/youtrack`. Do not include a protocol prefix such as `https://`, or any trailing path beyond `/youtrack`.

{% hint style="info" %}
**Logilica sees only what the token's account can see.** Use an account with read access to every project you want imported. A service account is the most stable choice, because a personal token stops working when that person leaves.
{% endhint %}

See [Connecting Tools](/integration/connecting-tools) for the general installation flow.

## What's Imported

For each YouTrack project you connect, Logilica imports:

* **Issues** — summary, description, type, state, priority, labels/tags, and created/updated/resolved dates
* **Assignees and reporters** — user identity, name, and email
* **Issue history** — created, state changes, assignee changes, resolution, sprint changes, and changes to any other custom field
* **Sprints** — name, start/end dates, and goal. If one of your issues is moved into a sprint that belongs to another board, that sprint is imported alongside it.
* **Parent/child relationships** — subtasks, parent issues, and the full ancestor chain
* **Story point estimates** — taken from a custom field (see Field & Type Configuration below)
* **Custom fields** — all other custom fields and their values are imported alongside the built-in fields
* **Optional tracking fields** — developer, reviewer, and tester assignment events when those custom fields are present (see Field & Type Configuration below)
* **Linked pull requests** — see [Linking Pull Requests and Tickets](/integration/linking-pull-requests-and-tickets)

{% hint style="info" %}
If your issue descriptions contain sensitive content, you can exclude them after installation with the **Ignore Ticket Description** toggle under **Import Configuration** on the connector page. The setting applies from the next scan onwards, and existing descriptions clear as each issue is next updated in YouTrack. Contact <support@logilica.com> for help if they need to be removed immediately.
{% endhint %}

## Issue State Mapping

Logilica sorts every issue state into **To Do**, **In Progress**, or **Done**. Most workflows need no setup, because common state names are recognised automatically. Capitalisation and spacing do not need to match.

| Category        | Recognised State Names                                                                                                                    |
| --------------- | ----------------------------------------------------------------------------------------------------------------------------------------- |
| **Done**        | `Fixed`, `Closed`, `Done`, `Complete`, `Released`, `Deployed`, `Merged`, `Duplicate`, `Won't Fix`, `Rejected`, `Cancelled`, and similar   |
| **In Progress** | `In Progress`, `Started`, `Active`, `In Development`, `In Review`, `Code Review`, `Testing`, `In QA`, `Verified`, `Reopened`, and similar |
| **To Do**       | `Open`, `To Do`, `New`, `Backlog`, `Planned`, `Draft`, `On Hold`, `Waiting`, `Blocked`, and anything not recognised                       |

There are two ways to correct a state that lands in the wrong category.

### Use YouTrack's Resolved flag

Any state flagged as Resolved counts as **Done**, whatever it is called:

1. Go to **Administration > Custom Fields** (or your project's field settings)
2. Open your **State** field's bundle
3. For each state that represents completion, check the **Resolved** checkbox

### Ask for a state mapping

Where the Resolved flag is not the right fit, for example a `Deferred` state that should count as Done or an `Awaiting Client` state that should count as In Progress, your state names can be mapped to categories for your whole organisation. A mapping overrides everything else, so it also covers a state you want moved out of the category above.

Contact <support@logilica.com> for help.

## Field & Type Configuration

Logilica reads these YouTrack fields by their exact name. If you've renamed any of them (for example `Status` instead of `State`), they won't be recognised:

| Field Name   | Used For                                     |
| ------------ | -------------------------------------------- |
| `Type`       | Issue type (Bug, Task, Epic, etc.)           |
| `State`      | Status category (To Do / In Progress / Done) |
| `Priority`   | Issue priority                               |
| `Estimation` | Due date calculation                         |
| `Assignee`   | Current assignee                             |

### Story points

To import story point estimates, your YouTrack project needs a custom field named exactly **`story points`** — lowercase, with a space. `Story Points`, `SP`, `Points`, or any other variation won't be picked up.

### Issue-type hierarchy

Logilica builds your work hierarchy from the issue type name:

| Issue Type Name                                   | Hierarchy Level |
| ------------------------------------------------- | --------------- |
| `Feature`, `Initiative`                           | Above Epic      |
| `Epic`                                            | Epic            |
| `Subtask`                                         | Below Task      |
| Anything else (`Bug`, `Task`, `Story`, and so on) | Task            |

Type names that include one of these words work too, so `Product Epic` and `Epic - Platform` both sit at Epic level. Capitalisation does not matter, and an issue with no type is treated as a Task.

If your types carry a hierarchy meaning Logilica cannot infer, such as `Theme`, `Capability`, or `Deliverable`, the level for each type name can be set for your organisation. Contact <support@logilica.com> for help.

### Optional tracking fields

If your team tracks who developed, reviewed, or tested an issue beyond the assignee, create these custom fields in YouTrack:

| Custom Field Name | What Logilica Tracks        |
| ----------------- | --------------------------- |
| `Developed By`    | Developer assignment events |
| `Reviewed By`     | Reviewer assignment events  |
| `Tested By`       | Tester assignment events    |

These are optional. If present, changes to these fields appear as distinct events in Logilica's activity timeline. The names are matched case-insensitively.

## Good to Know

* **Kept in sync automatically.** After the initial import, Logilica refreshes this connection on a regular schedule — you don't need to re-trigger imports.
* **First import covers the last 6 months.** Only issues updated within the last 6 months are imported on the first scan. Older issues that haven't been touched won't appear. The window can be widened, so contact <support@logilica.com> for help if you need more history.
* **Empty sprints won't appear.** A sprint that has never had an issue assigned to it won't show up in Logilica.
* **Comments, attachments, and work logs are not imported.** The `Spent time` field value is captured as a custom field, but individual time tracking entries are not imported separately.
* **Only state changes count as status changes.** Editing other fields, such as `Priority` or `Type`, does not affect how long an issue is reported as sitting in each status.
* **Use an uppercase project short name.** A short name that is lowercase or mixed case, such as `demo`, will not match the ticket IDs in your pull requests, so those issues show no linked code activity.
* **Avoid renaming a project's short name.** Issue IDs are built from it, so renaming it after onboarding breaks continuity with data already imported.


# GitHub Actions

The GitHub Actions connector imports your workflow runs into Logilica so build performance and reliability feed into the [Build dashboard](/metrics-and-reports/build), and — once deployment detection is configured — the [DORA metrics](/configuration/dora-configuration).

## Authentication

GitHub Actions data is imported through your existing GitHub connection — there is no separate connector to configure. Once GitHub is connected (via OAuth, a personal access token, or a GitHub App installation), Logilica imports workflow run data for each repository automatically. See [Connecting Tools](/integration/connecting-tools) for how to set up the GitHub connection.

## What's Imported

For each repository, Logilica imports completed workflow runs and the work beneath them:

* **Workflow runs** — name (falling back to the workflow identifier when a run has no name), link to the run on GitHub, created and started timestamps, and the resolved completion time
* **Status and conclusion** — the run's `status` and `conclusion` as reported by GitHub
* **Triggering actor** — the person or account that triggered the run
* **Commit and branch** — the head commit and the branch the run executed against
* **Pull request associations** — any pull requests linked to the run
* **Jobs and steps** — the jobs in each run and the steps within them, with their names, links, and timings

## How Logilica Maps the Data

Build outcomes are normalised so that success, failure, and cancelled results are consistent across every CI/CD platform Logilica supports. The values shown match those reported by GitHub.

{% hint style="info" %}
**In-progress runs are skipped.** Only workflow runs that have completed are imported. Runs that are still queued or running are left out until they finish and are picked up on a later scan.
{% endhint %}

## Good to Know

* **Kept in sync automatically.** After the initial import, Logilica refreshes this connection on a regular schedule — you don't need to re-trigger imports.
* **First import covers the last 6 months.** The initial scan imports workflow runs created within the last 6 months. Importing older history requires a configuration change by Logilica — contact support.
* **Release detection flags deployments.** Logilica runs [release detection](/configuration/release-detection) over imported builds, flagging the runs that represent deployments so they can power your DORA metrics.
* **There is a cap on imported runs per repository.** Logilica imports up to roughly the most recent 1000 workflow runs per repository at onboarding. Future runs are added to the stored history as they complete.
* **It feeds Build and DORA.** Imported runs power the [Build dashboard](/metrics-and-reports/build) (build frequency, reliability, speed, and recovery time) and, once [Release Detection](/configuration/release-detection) is configured, the [DORA metrics](/configuration/dora-configuration).
* **Push your own build data.** If you run builds that this connector doesn't cover, you can send them via the [Build Data Import API](/advanced/import/build-data).


# GitLab Pipelines

The GitLab Pipelines connector imports your CI/CD pipelines into Logilica so build performance and reliability feed into the [Build dashboard](/metrics-and-reports/build), and — once deployment detection is configured — the [DORA metrics](/configuration/dora-configuration).

## Authentication

GitLab pipeline data is imported through your existing GitLab connection — there is no separate connector to configure. Once GitLab is connected, Logilica imports pipeline data for each project automatically. See [Connecting Tools](/integration/connecting-tools) for how to set up the GitLab connection.

## What's Imported

For each project, Logilica imports finished pipelines and the work beneath them:

* **Pipelines** — identified by their branch reference and trigger source, with a link to the pipeline on GitLab
* **Timestamps** — created, started, and finished times
* **Build outcome** — whether the pipeline succeeded, failed, or was cancelled
* **Triggering user** — the user that ran the pipeline
* **Commit and branch** — the commit and branch the pipeline ran against
* **Merge request associations** — where a pipeline ran against a merge request reference, the associated merge request is linked
* **Stages and jobs** — every job in the pipeline, grouped by its stage

## How Logilica Maps the Data

Build outcomes are normalised so that success, failure, and cancelled results are consistent across every CI/CD platform Logilica supports.

{% hint style="info" %}
**Only finished pipelines are imported.** Logilica requests pipelines that have completed, so runs that are still in progress are left out until they finish and are picked up on a later scan.
{% endhint %}

## Good to Know

* **Kept in sync automatically.** After the initial import, Logilica refreshes this connection on a regular schedule — you don't need to re-trigger imports.
* **First import covers the last 6 months.** The initial scan imports pipelines updated within the last 6 months. Importing older history requires a configuration change by Logilica — contact support.
* **Release detection flags deployments.** Logilica runs [release detection](/configuration/release-detection) over imported builds, flagging the pipelines that represent deployments so they can power your DORA metrics.
* **Up to 1000 pipelines per project.** Logilica imports up to the most recent 1000 finished pipelines per project at onboarding. Future pipelines are added to the stored history as they complete.
* **It feeds Build and DORA.** Imported pipelines power the [Build dashboard](/metrics-and-reports/build) (build frequency, reliability, speed, and recovery time) and, once [Release Detection](/configuration/release-detection) is configured, the [DORA metrics](/configuration/dora-configuration).
* **Push your own build data.** If you run builds that this connector doesn't cover, you can send them via the [Build Data Import API](/advanced/import/build-data).


# CircleCI

The CircleCI connector imports your pipelines into Logilica so build performance and reliability feed into the [Build dashboard](/metrics-and-reports/build), and — once deployment detection is configured — the [DORA metrics](/configuration/dora-configuration).

## Authentication

CircleCI is a standalone connector authenticated with a CircleCI API token. Logilica uses the token to identify which account has access to each repository, then imports pipeline data for the projects that account can see. See [Connecting Tools](/integration/connecting-tools) for how to add the token.

{% hint style="info" %}
**CircleCI projects must be backed by GitHub or Bitbucket.** Logilica matches each connected repository to its CircleCI project using the repository's version control provider. Only projects hosted on GitHub or Bitbucket are supported.
{% endhint %}

## What's Imported

For each matched CircleCI project, Logilica imports pipelines and the work beneath them:

* **Pipelines** — named after the project and pipeline number, with a link to the pipeline in CircleCI
* **Timestamps** — created and started times, and job completion times
* **Build outcome** — whether the pipeline succeeded, failed, or was cancelled
* **Triggering actor** — the account that triggered the pipeline
* **Commit and branch** — the commit revision and branch
* **Workflows and jobs** — each job within each workflow of the pipeline

## How Logilica Maps the Data

Build outcomes are normalised so that success, failure, and cancelled results are consistent across every CI/CD platform Logilica supports.

## Good to Know

* **Kept in sync automatically.** After the initial import, Logilica refreshes this connection on a regular schedule — you don't need to re-trigger imports.
* **First import covers the last 6 months.** The initial scan imports pipelines created within the last 6 months, paging back through history until it reaches that window. Importing older history requires a configuration change by Logilica — contact support.
* **Up to 1000 pipelines per project.** Logilica imports up to roughly the most recent 1000 pipelines per project at onboarding. Future pipelines are added to the stored history as they complete.
* **GitHub or Bitbucket backend required.** A repository's CircleCI project is only discovered when the repository is hosted on GitHub or Bitbucket.
* **It feeds Build and DORA.** Imported pipelines power the [Build dashboard](/metrics-and-reports/build) (build frequency, reliability, speed, and recovery time) and, once [Release Detection](/configuration/release-detection) is configured, the [DORA metrics](/configuration/dora-configuration).
* **Push your own build data.** If you run builds that this connector doesn't cover, you can send them via the [Build Data Import API](/advanced/import/build-data).


# Buildkite

The Buildkite connector imports your builds into Logilica so build performance and reliability feed into the [Build dashboard](/metrics-and-reports/build), and — once deployment detection is configured — the [DORA metrics](/configuration/dora-configuration).

## Authentication

Buildkite is a standalone connector authenticated with a Buildkite API token. Logilica uses the token to discover the pipelines that match each connected repository within your Buildkite organisation, then imports the builds for those pipelines. The token needs the `read_builds`, `read_organizations`, `read_pipelines`, and `read_user` scopes, and you must select the organisation to import from. See [Connecting Tools](/integration/connecting-tools) for how to add the token and supply your organisation and repository details.

{% hint style="info" %}
**Your organisation slug and repository URL are required.** Logilica matches Buildkite pipelines to a repository using the organisation slug and the repository's remote URL. If either is missing, no build data is imported for that repository.
{% endhint %}

## What's Imported

For each matched pipeline, Logilica imports builds and the work beneath them:

* **Builds** — the pipeline name, a link to the build in Buildkite, and the build's created, started, and finished times
* **Build outcome** — whether the build succeeded, failed, or was cancelled
* **Triggering actor** — the person who triggered the build
* **Commit and branch** — the commit hash and branch
* **Jobs** — each job in the build, with its name, timestamps, and link

## How Logilica Maps the Data

Build outcomes are normalised so that success, failure, and cancelled results are consistent across every CI/CD platform Logilica supports.

{% hint style="info" %}
**Running builds are skipped.** Only builds that have finished are imported. In-progress builds are left out until they finish and are picked up on a later scan.
{% endhint %}

## Good to Know

* **Kept in sync automatically.** After the initial import, Logilica refreshes this connection on a regular schedule — you don't need to re-trigger imports.
* **First import covers the last 6 months.** The initial scan imports builds created within the last 6 months, paging back through history until it reaches that window. Importing older history requires a configuration change by Logilica — contact support.
* **Up to 1000 builds per pipeline.** Logilica imports up to roughly the most recent 1000 builds per pipeline at onboarding. Future builds are added to the stored history as they complete.
* **Build authors are attributed.** The people who trigger your builds are matched to their Logilica identities, so build activity is attributed correctly.
* **It feeds Build and DORA.** Imported builds power the [Build dashboard](/metrics-and-reports/build) (build frequency, reliability, speed, and recovery time) and, once [Release Detection](/configuration/release-detection) is configured, the [DORA metrics](/configuration/dora-configuration).
* **Push your own build data.** If you run builds that this connector doesn't cover, you can send them via the [Build Data Import API](/advanced/import/build-data).


# Codecov

The Codecov connector imports per-commit coverage data and individual test results into Logilica, so code coverage trends and test reliability sit alongside the rest of your engineering data.

## Authentication

Codecov is a standalone connector authenticated with a Codecov API token. Logilica sends the token as a Bearer credential against the Codecov v2 API (`https://api.codecov.io/api/v2`) and reads coverage for the repository you connect. See [Connecting Tools](/integration/connecting-tools) for how to add the token.

Each connection is scoped to a single repository, identified by its version control service (GitHub, GitLab, or Bitbucket), owner, and repository name.

## What's Imported

For each connected repository, Logilica imports two kinds of data:

* **Per-commit coverage** — for every commit, the overall coverage percentage, total lines of code, hits, partials, and misses, the number of files, the branch, the commit state, and whether CI passed. The commit author is recorded as a contributor identity.
* **File-level coverage** — within each commit, per-file coverage, lines of code, hits, partials, and misses, where Codecov has a full report for that commit.
* **Test results** — individual test outcomes (pass, fail, skip, or error), test duration, the test name, the branch, and any failure message. All imported test results are marked as automated.

Coverage and test result pages in Codecov are linked back to the Codecov app so you can open the original report.

## Test Outcomes

Test outcomes are shown in a consistent category:

| Codecov outcome                      | Logilica category |
| ------------------------------------ | ----------------- |
| `pass`, `passed`, `success`          | Pass              |
| `fail`, `failed`, `failure`, `error` | Failure           |
| `skip`, `skipped`                    | Skipped           |
| anything else                        | Unknown           |

## Good to Know

* **Kept in sync automatically.** After the initial import, Logilica refreshes this connection on a regular schedule — you don't need to re-trigger imports.
* **First import covers the last 6 months.** The initial scan imports commit coverage from the last 6 months, paging back through history until it reaches that window. Later scans pick up data added since the previous import. Importing older history requires a configuration change by Logilica — contact support.
* **Coverage is only as complete as Codecov's report.** If Codecov has no full report for a commit (for example, an incomplete or in-progress upload), that commit is imported with its overall totals but without file-level breakdown.
* **One repository per connection.** A connection covers a single repository. Connect each repository whose coverage you want in Logilica.
* **Test results are dated from their commit.** A test result whose commit falls outside the import window is not imported.


# Cursor

The Cursor connector imports daily AI coding usage for every member of your Cursor team, so your AI Coding dashboard reflects how the tool is actually being used — lines written by AI, interaction types, token spend and AI-attributed commits.

## Authentication

Logilica connects to Cursor with a Cursor **Admin API key**, supplied when you install the connector. Create one in Cursor under **Settings > Advanced > Admin API keys**. Installation also asks for a **username** to associate the connector with. Logilica only reads usage and analytics data — it never writes to your Cursor team.

See [Connecting Tools](/integration/connecting-tools) for the general installation flow.

## What's Imported

Logilica imports usage at a **daily, per-user** granularity, keyed on the team member's email. For each member and day it brings in:

* **Lines added and deleted by AI** — the AI-written line counts Cursor attributes to that developer for the day, not total lines changed in their commits.
* **Accepts and rejects** — accepted and rejected AI suggestions, including tab completions shown versus accepted.
* **Interaction types** — usage broken down by interaction type, such as composer, chat, agent and tab completions.
* **Request types** — requests split into **subscription-included**, **API key** and **usage-based (pay-per-use)** requests.
* **Most-used model** — the model the developer used most that day.
* **Token counts** — total token usage, summed per developer per day.
* **Estimated cost** — the spend Cursor attributes to that developer's usage for the day.
* **Modified files** — the files an AI change touched that day, with per-file AI lines added and deleted.

Logilica also imports **AI-attributed commits**: commit hash, repository, branch, author and the lines added and deleted by AI within each commit. Team members are discovered from your Cursor team roster so contributor identities resolve correctly.

## Good to Know

* **Kept in sync automatically.** After the initial import, Logilica refreshes this connection on a regular schedule — you don't need to re-trigger imports.
* **First import covers the last 180 days.** Logilica pulls the most recent 180 days of Cursor usage on the first scan.
* **Cursor data feeds the AI Coding dashboard**, where AI usage is shown alongside your delivery metrics.


# Claude Code

The Claude Code connector imports daily Claude Code usage for every developer in your Anthropic organisation, so your AI Coding dashboard shows how the tool contributes to your work — lines written, tool acceptance, token usage and estimated cost.

## Authentication

Logilica connects to Anthropic's organisation usage reporting at `https://api.anthropic.com` using an **Admin API key**, supplied in the `x-api-key` header.

An Admin API key is required — a standard Anthropic API key cannot read organisation-wide usage and cost reports. Admin keys are the only keys with access to the usage reporting used by this connector. The key is provided when you install the connector, and Logilica only reads usage data.

See [Connecting Tools](/integration/connecting-tools) for the general installation flow.

## What's Imported

Logilica reads Anthropic's Claude Code usage report and imports usage at a **daily, per-user** granularity, keyed on each developer's email address. For each developer and day it brings in:

* **Lines added and removed by Claude Code** — the AI-attributed line counts for that day.
* **Tool accepts and rejects** — accepted and rejected tool actions (edits, multi-edits, notebook edits and file writes), summed into total accepts and rejects.
* **Token counts** — total token usage, summed across all models used that day.
* **Estimated cost** — the estimated spend across all models for the day.
* **Most-used model** — the model the developer used most that day.

Contributor identities are created from the email address on each usage report, so usage resolves to the right developer and team.

## Good to Know

* **Kept in sync automatically.** After the initial import, Logilica refreshes this connection on a regular schedule — you don't need to re-trigger imports.
* **First import covers the last 180 days.** Logilica requests usage starting from 180 days before the scan date.
* **Usage is reported per day, per developer.** Unlike GitHub Copilot, Claude Code provides a per-user breakdown, so individual developer usage appears on the dashboard.
* **Claude Code data feeds the AI Coding dashboard**, where AI usage is shown alongside your delivery metrics.


# GitHub Copilot

The GitHub Copilot connector imports Copilot usage metrics for your organisation and teams, so your AI Coding dashboard shows how Copilot is adopted and used across the business — code suggestions, chat activity, pull request summaries and active-user trends.

## Authentication

GitHub Copilot is **not a standalone connector**. It is enabled through your existing **GitHub** or **GitHub App** connector by turning on AI usage data in the connector's settings after installation. Logilica reuses the same GitHub authentication — OAuth, a Personal Access Token or a GitHub App installation — to read Copilot metrics for your organisation.

See [Connecting Tools](/integration/connecting-tools#connector-settings) for where to enable AI usage data on the GitHub connector.

## What's Imported

Logilica first reads your Copilot seat assignments to determine the granularity of import:

* If seats are assigned through **teams**, Logilica imports metrics for **each team** that has Copilot seats.
* If no team assignments are found, Logilica imports metrics for the **whole organisation**.

For each organisation or team, and for each day, Logilica imports:

* **Code completions** — accepted suggestions, total suggestions, and lines added versus lines suggested by AI.
* **Interaction types** — IDE and dotcom **chat**, **chat insertions**, **chat copies**, and **pull request summaries** created by Copilot, plus a combined interaction count.
* **Most-used model** — the model with the highest usage across completions, chat and pull request summaries.
* **Active-user percentage** — the share of seat holders who were active that day.

{% hint style="info" %}
The Copilot metrics API returns **aggregated** data only — there is **no per-user breakdown**. Logilica records usage against the organisation or the team as a group, not against individual developers. To see how active a group is day to day, use the active-user percentage rather than per-person figures.
{% endhint %}

## Good to Know

* **Kept in sync automatically.** After the initial import, Logilica refreshes this connection on a regular schedule — you don't need to re-trigger imports.
* **The import window is the last 100 days** — not the 180 days used by Cursor and Claude Code, and not the 6-month window used by other connectors. This is a limit of the Copilot metrics API.
* **Data is aggregate-only.** Because the Copilot API does not expose individual usage, per-developer breakdowns are not available for Copilot, even though they are available for Cursor and Claude Code.
* **If no Copilot seats are assigned, nothing is imported** and the connector finishes without adding data.
* **GitHub Copilot data feeds the AI Coding dashboard**, where AI usage is shown alongside your delivery metrics.


# Humanitec

The Humanitec connector imports your applications, environments, and deployments into Logilica, so deployment activity and reliability feed directly into your [DORA metrics](/configuration/dora-configuration).

## Authentication

Humanitec is a standalone connector authenticated with a Humanitec API token and your Humanitec organisation ID. Logilica sends the token as a Bearer credential against the Humanitec API (`https://api.humanitec.io/orgs/{orgId}`) and reads data for the organisation you supply. See [Connecting Tools](/integration/connecting-tools) for how to add the token and organisation ID.

## What's Imported

For the connected organisation, Logilica walks the full hierarchy and imports:

* **Applications** — name, creation time, and creator
* **Environments** — name, namespace, environment type, creation time, and creator, plus references to each environment's first and most recent deployment
* **Environment types** — the organisation's environment type definitions and their descriptions
* **Deployments** — comment, creation time, the user who deployed, the deployment status, and the time the status last changed
* **Users** — the people who created applications, environments, and deployments are recorded as contributor identities

## How the Data Feeds DORA

Logilica models Humanitec as an Applications → Environments → Deployments hierarchy. Imported deployments feed Logilica's [DORA metrics](/configuration/dora-configuration) — deployment frequency and time to recovery in particular.

## Good to Know

* **Kept in sync automatically.** After the initial import, Logilica refreshes this connection on a regular schedule — you don't need to re-trigger imports.
* **The whole organisation is imported.** The connector walks every application, environment, and deployment in the organisation you connect, rather than a single project. Connect the organisation whose deployment activity you want in Logilica.
* **Deployment status drives DORA.** Logilica relies on Humanitec's `failed` and `succeeded` deployment statuses. Deployments in other states still import but do not contribute to recovery timing.
* **Contributor identities come from deployment metadata.** People are discovered from the creators of applications, environments, and deployments. A user who has never created any of these will not appear.
* **It feeds DORA.** Imported deployments power Logilica's [DORA metrics](/configuration/dora-configuration) — deployment frequency and time to recovery in particular.


# Security Findings (SARIF)

Logilica imports security scan results in SARIF format, so findings from your security scanners sit alongside the rest of your engineering data. Any scanner that emits standard SARIF is supported — Snyk, CodeQL, Coverity, and others.

## Authentication

Security findings are sent to Logilica's import API rather than pulled from a scanner. You push SARIF data from your CI/CD pipeline to the `/sarif` endpoint, authenticated with your Logilica API token and domain supplied as request headers (`X-lgca-token` and `X-lgca-domain`). See the [Import API](/advanced/import) for how to obtain a token and call the endpoint.

Each upload is a single SARIF document tied to one repository and one commit.

## What's Imported

From each SARIF document, Logilica imports:

* **Tool name** — the scanner that produced the run, used to attribute every rule and finding to a source
* **Rules** — each rule's ID, name, and severity level, plus any associated CWE identifiers
* **Results** — each finding, with the affected file, the rule it relates to, and the result message
* **Commit and time** — the commit the scan ran against, so findings line up with the rest of your repository history

## Good to Know

* **Findings update when you upload.** SARIF data is pushed from your pipeline, so results refresh each time your pipeline uploads a new scan — there is no automatic background sync.
* **Any SARIF-compliant scanner works.** Because Logilica reads standard SARIF fields, any tool that emits valid SARIF can be uploaded — Snyk, CodeQL, Coverity, and others — without per-scanner configuration. The scanner identifies itself through the run's tool name.
* **A document may contain multiple runs.** Each run in a SARIF document's `runs` array is imported in turn, so a single upload can carry findings from more than one scan.
* **Each upload is scoped to one commit.** An upload carries the repository and the commit the scan ran against. Push a SARIF document per scan from your pipeline so findings stay tied to the right commit.
* **The upload must be valid SARIF.** A document with no runs, or a run that does not identify its scanner, is rejected. See the [Import API](/advanced/import) for the exact request format.

{% hint style="info" %}
**Findings are imported via direct upload only.** SARIF data is brought in by pushing it to the import API from your pipeline. Automatic collection of GitHub Code Scanning results through the GitHub connector is not currently active — send your scan output to the upload endpoint instead.
{% endhint %}


# Linking Pull Requests and Tickets

Logilica automatically links pull requests to your planning tickets, such as Jira tickets or Azure DevOps work items, by looking for the ticket ID in your pull requests. This linking is what powers the "Linked Task", "Ticket Without PR", and "Unlinked Pull Request" categories across dashboards.

## How Linking Works

Logilica looks for your ticket ID in four places, and finding it in any one of them creates the link:

| Location                  | Example                               |
| ------------------------- | ------------------------------------- |
| **Branch name**           | `feature/LPAV-1056-add-login`         |
| **PR title**              | `[LPAV-1056] Fix authentication bug`  |
| **PR description / body** | `Closes LPAV-1056, resolves LPAV-731` |
| **Commit messages**       | `LPAV-1056: update error handling`    |

Capitalisation does not matter, so `lpav-1056` and `LPAV-1056` resolve to the same ticket.

### Multiple Tickets

A single PR can link to multiple tickets. For example:

* **Branch:** `lpav-1056-lpav-1057-do-stuff` → links to `LPAV-1056` and `LPAV-1057`
* **Title:** `[LPAV-1056][LPAV-731] Do stuff` → links to `LPAV-1056` and `LPAV-731`
* **Body:** `Closes MATT-3, closes MATT-56` → links to `MATT-3` and `MATT-56`

Tickets found across all four locations are combined and deduplicated.

## Supported Connectors

This linking logic is **shared across all code connectors**:

* GitHub
* GitLab
* Bitbucket
* Azure DevOps

The same extraction rules apply regardless of which code hosting platform you use.

{% hint style="warning" %}
**Project keys within the Ticket tools must be uppercase.** A planning project whose key is lowercase or mixed case will not match. Jira enforces uppercase project keys, but YouTrack short names and Azure DevOps project names do not, so set those in uppercase if you rely on linking.
{% endhint %}

## Why Linking Matters

Linked PRs and tickets are the foundation of several Logilica metrics and views:

| Category                  | Meaning                                  | Where It Appears                                            |
| ------------------------- | ---------------------------------------- | ----------------------------------------------------------- |
| **Linked Task**           | A ticket with at least one associated PR | Activity dashboards, Team Pulse                             |
| **Ticket Without PR**     | A ticket that has no associated PR       | Highlights planning items with no code activity             |
| **Unlinked Pull Request** | A PR that doesn't match any known ticket | Highlights code work happening outside the planning process |

High numbers of unlinked PRs or tickets without PRs may indicate that the team isn't following consistent linking practices, which reduces the accuracy of cross-functional metrics like lead time and delivery tracking.

## Best Practices

### Include Ticket Keys in PR Titles

The most reliable and visible approach is to include the ticket key in the PR title:

```
LPAV-1056: Add user authentication flow
```

or

```
[LPAV-1056] Add user authentication flow
```

This ensures the link is created regardless of branch naming conventions or commit message practices.

### Use Consistent Branch Naming

If your team uses branch naming conventions, include the ticket key:

```
feature/LPAV-1056-add-authentication
bugfix/LPAV-731-fix-login-error
```

### Reference Tickets in PR Descriptions

For PRs that address multiple tickets, list them in the description:

```
This PR addresses:
- LPAV-1056: Authentication flow
- LPAV-731: Login error handling
```

### Avoid Common Pitfalls

* **Reference the ticket by its full ID** — an ID such as `LPAV-1056` is recognised, while `#123` or `GH-issue-45` is not
* **The ticket must exist in a connected planning tool** — a ticket from a project you have not connected cannot be linked
* **Don't rely on a single location** — including the key in both the branch name and PR title provides redundancy

## If Pull Requests Are Not Linking

* **Check the pull request, not just the commit.** Squash merges rewrite commit messages, so an ID that lived only in the original commits may not survive the merge. The branch name and pull request title are the most reliable places to put it.
* **Allow for the next scan.** Links appear after the next scan of your Git connector, not instantly.
* **Confirm both projects are imported.** The ticket's planning project and the repository must both be connected to Logilica.

If the ID is referenced correctly and links are still missing, contact <support@logilica.com> for help, with one example pull request URL and the ticket ID it should have matched.

## Checking Your Linking Coverage

To assess how well your team is linking PRs and tickets:

1. Navigate to the **Code Activities / Risks** dashboard and filter for "Unlinked Pull Requests"
2. Check the **Activity** views for the ratio of Linked Tasks vs. Tickets Without PR and Unlinked Pull Requests
3. A high proportion of unlinked items suggests the team needs to adopt more consistent ticket referencing

If you notice a significant number of unlinked PRs, consider adding a PR template to your repositories that prompts authors to include the ticket key.


# Uploading Custom Data

Logilica provides different means to upload custom data and the support of additional data sources. To enable custom data upload and the use of Logilica's APIs, contact <support@logilica.com>.

For more information about API use, see the [Import API ](/advanced/import)pages.


# Introduction

Logilica organises its insights into **Workstreams**, **Dashboards**, and **Charts**. Once you connect your data sources, all dashboards are populated automatically — no manual configuration required.

## How Logilica Is Structured

### Sections

The left sidebar groups dashboards into high-level sections:

* **Improve** — delivery-focused dashboards covering planning accuracy, delivery status, work progress, review health, build stability, and AI coding analytics
* **Teams** — team-level views including Teams Overview, Team Pulse, and Activity Lens
* **SDLC** — software development lifecycle views broken into Plan, Code, and Build stages

### Workstreams

Within each section, workstreams group related dashboards. For example, the **Plan** workstream under SDLC contains dashboards for Ticket Lead Time, Ticket Velocity, Sprint Health, and more.

### Dashboards

Each dashboard contains interactive charts and tables with global filters for **time range**, **team**, **project/repository**, and **ticket board**. Filters persist across navigation so you can explore different views for the same selection.

## Key Concepts

| Concept                | Description                                                                                                                                                 |
| ---------------------- | ----------------------------------------------------------------------------------------------------------------------------------------------------------- |
| **Cycle Time**         | The lifecycle duration of a PR or ticket — broken into stages (Development, Response, Review, Integration for PRs; Backlog, Pickup, Resolution for tickets) |
| **Work Types**         | How coding effort is categorised: New, Maintenance, Rework Own, Rework Others                                                                               |
| **DORA Metrics**       | Four industry-standard metrics for software delivery performance: Deployment Frequency, Lead Time for Changes, Change Failure Rate, Mean Time to Recovery   |
| **Risks & Activities** | Automated flags for process issues: Stale PRs, Long Running WIP, Risky Changes, PRs Merged Outside Process, and more                                        |

## What's in This Section

* [Navigation](/metrics-and-reports/introduction/navigation) — how the sidebar, workstreams, and dashboards are organised
* [Dashboards](/metrics-and-reports/introduction/dashboards) — how dashboards work, global filters, and editing options
* [Data Exploration](/metrics-and-reports/introduction/data-exploration) — how to drill down into charts and explore evidence


# Navigation

The left-hand navigation pane is used to access most of Logilica's insights and reports. The navigation is structured around key concepts:

* **Sections** are groupings of similar areas, such as insights on your delivery or insight across your teams' activities. Sections can folded/unfolded to focus on what is important at the time.
* **Work Streams** are a collection of dashboards. For instance, insights and reports around, e.g., planning activities or coding activities.
* **Dashboards** contain the actual insights in the form of charts and tables, as well as other informational content.

<figure><img src="https://3637178088-files.gitbook.io/~/files/v0/b/gitbook-x-prod.appspot.com/o/spaces%2FvMP8keAdyp2axoLILtL5%2Fuploads%2Fgit-blob-28a3aece508c91893f5b6f83dbed9065d807f7d1%2Fworkstream-plan.png?alt=media" alt=""><figcaption><p>Improve section, with the Plan work stream and Epics Cockpit dashboard</p></figcaption></figure>

Logilica comes pre-configures out-of-the-box and populates all dashboards once the corresponding connectors have been established.

Enterprise customers can fully customise all aspects, including layouts, charts and metrics. For more information, contact <support@logilica.com>.


# Dashboards

Most of Logilica's information is in prepopulated dashboards and reports generated from the connected data sources.

Generally, each dashboard consists of several charts or tables that are typically interactive and can be drilled down into to see further details and evidence.

Each dashboard has **global filters** such as **time ranges**, the **teams** it applies to, and other filters such as **repositories** or **boards**. Global filters persist across navigation to explore different viewpoints for the same selection.

<figure><img src="https://3637178088-files.gitbook.io/~/files/v0/b/gitbook-x-prod.appspot.com/o/spaces%2FvMP8keAdyp2axoLILtL5%2Fuploads%2Fgit-blob-b939355b2a655ffe6fa29cea67358c864a0d8a19%2Fdashboard.png?alt=media" alt=""><figcaption><p>Dashboard with time picker, team and repository selector</p></figcaption></figure>

Depending on your access rights and the plan you are on, you can further edit and customise the layout, content and details of the dashboards. If that feature is enabled for you and your organisation, an additional option will be displayed at the top of the dashboard.

<figure><img src="https://3637178088-files.gitbook.io/~/files/v0/b/gitbook-x-prod.appspot.com/o/spaces%2FvMP8keAdyp2axoLILtL5%2Fuploads%2Fgit-blob-0f962212a3206e1fc25cc2f9c29d74f0ddfd6b47%2Fedit%20dashboard.png?alt=media" alt="" width="214"><figcaption><p>Editing dashboards on Enterprise Plan</p></figcaption></figure>

For more information, contact <support@logilica.com>.


# Data Exploration

The Logilica platform offers a wide range of predefined charts and data insights. Each dashboard or report typically contains a number of **charts** from **individual data sources** or **across data sources**.

For instance, Logilica **automatically detects** coding activity **correlated** to tickets, links up that information and displays corresponding insights.

The below shows parts of an Epics Cockpit that break down the epic by its current investment focus based on labels, its velocity in delivering over time as well as risk factors on the tickets as well as their corresponding coding activities (PR) that have been automatically detected.

<figure><img src="https://3637178088-files.gitbook.io/~/files/v0/b/gitbook-x-prod.appspot.com/o/spaces%2FvMP8keAdyp2axoLILtL5%2Fuploads%2Fgit-blob-a8580def8cf1b4bf376868613ace150ba0ae318e%2Fepics%20cockpit.png?alt=media" alt=""><figcaption><p>Snapshot of an Epic</p></figcaption></figure>

Each chart is typically associated with some **drill-down action,** allowing you to follow the trace of evidence and explore causes in more detail.

Below is the drill-down view into the coding activity for two teams over the last 30 days and the state of each PR as well as some of the **associated risks**. Like most Logilica data views, additional **filters** as well as **slice & dice** operations can be applied.

<figure><img src="https://3637178088-files.gitbook.io/~/files/v0/b/gitbook-x-prod.appspot.com/o/spaces%2FvMP8keAdyp2axoLILtL5%2Fuploads%2Fgit-blob-70870855e39e8f6783cc044023e56e7915f16812%2Fpull%20request%20explorer.png?alt=media" alt=""><figcaption><p>PR Data Exploration to understand causes</p></figcaption></figure>


# Epics Delivery Tracker

## Purpose

The epic delivery tracker provides a high-level overview of all the epics of an organisation that are currently in progress, their recent epic activities and the forecasted completion date.

This assists engineering and product leaders to stay on top of many parallel strands of work and track against delivery goals.

## Explanations

**Epic**: shows the epic name and the number of items (issues, tasks, etc.) in that epic.

**Progress**: Shows the currently completed and total number of items in the epic. This gives you some relative progress indication.

**Status**: Epics status as set in Jira, GitHub Project, etc.

**Burndown**: Relative burndown of items in the epic. Upward spikes mean new items have been added to an existing epic.

**Code activity**: Indicates PR activities such as open/close/merge to gauge where teams are active.

**Target**: Delivery target dates as defined in Jira, GitHub Projects etc. If no target date is set, the cell will show as “Not set”.

**Forecast**: Estimated delivery date projected from the epic's recent delivery trend. It says "**Waiting**" if the epic has not yet started (as defined in the planning tool) and "**Completed**" once all items in the epic are completed.

**Variance**: The Variance shows the difference to the target date defined in your planning tool. If the planning tool does not have a set target date, no variance is computed and “**Untracked**” is displayed.

## Good to Know

**History**: The delivery tracker shows all epics that are currently open. After the initial onboarding, the timeline is capped at 6 months of history but then tracks any new epics from their inception dates. This means new epics will always be tracked over their complete lifetime.

**Forecast vs Status**: The Forecast will show completed when all epic items are completed. However, the Status might still show "in progress" or similar as the latter comes out of Jira/GitHub Projects etc. and might not have yet been manually set to complete.


# Planning

Logilica's unified planning metrics and dashboards.

Logilica provides analytics and insights for a number of ticketing and planning solution including Jira, GitHub Project, GitLab Plan and Azure DevOps Boards.

For a unified view Logilica uses the following canonical representation of ticket stages:

<figure><img src="https://3637178088-files.gitbook.io/~/files/v0/b/gitbook-x-prod.appspot.com/o/spaces%2FvMP8keAdyp2axoLILtL5%2Fuploads%2Fgit-blob-24ad219575df83f4bae24a11073edffa61e58454%2Fticket%20stages.png?alt=media" alt="" width="563"><figcaption></figcaption></figure>

These stages as defined as follows:

* **Backlog**: spans tickets creation to an assignment to a contributor.
* **Pickup**: spans from assignment to a contributor until its status changes to an in-progress stage.
* **Resolution**: time from being in-progress until being marked as resolved/done etc.


# Ticket Lead Time

Track and improve the speed at which you are able to deliver features.

## Purpose

Being effective and responsive to customer needs depends a lot on the cadence and flow of the delivery process. One indication of the delivery process flow is the lifecycle time of feature and bug tickets. The ticket lead time tracks the time of a ticket from entering the backlog to being closed. The shorter the lead time, the more responsive an organisation can potentially be.

{% hint style="success" %}
**Improvement Actions**: Long lead times might result from too large tasks that have either not been specified clearly or are not broken down further. More detailed and broken-down tasks can help to make improvements.

While not always possible, smaller tasks typically lead to shorter review cycles, less QA work and easier schedulability by the team as well.

Other causes for long lead times include resource-constrained and overloaded teams that are challenged with interrupting work.
{% endhint %}

## Explanations

This report tracks the ticket lifecycle for teams and boards. Unlike Jira and similar planning tools, views can be aggregated across boards and across teams for a holistic view. Some of the charts in this report include:

**Lead Time**: The cycle time from creating a ticked until it is closed, i.e., being done.

**Stages**: Breakdown of lead time into their respective ticket stages. By default, these:

* **Backlog**: time from ticket creation to an assignment to a contributor.
* **Pickup**: time from being assigned until its status changes to an in-progress stage.
* **Resolution**: time from being in progress until being marked as resolved/done etc.

**Distribution**: Shows all the tickets clustered into different lead time buckets. This enables you to quickly identify outliers and investigate why certain tickets might have taken a long time to close. Common causes can indicate specific work patterns or process problems to be addressed.

**Breakdown by Stage**: Shows the lead time trend over time broken down by lifecycle stage. This gives indications about work pattern consistency and changes in efficiency.

**Issue Type breakdown**: This view shows how different ticket types (Issue types as defined in Jira, GitHub Projects, etc.) are affecting their respective lead times. Oftentimes, not all ticket types are handled equally in an organisation, and variances are expected. Conversely, it might point to problems with certain issue types.

## Good to Know

By default, all the status changes, progress stages and issue types are imported from your connected planning tool, such as Jira, GitHub Projects, etc. For consistency, Logilica maps status to the categories of Backlog, In Progress and Resolution. See more details of the mapping.


# Ticket Velocity

Track and improve how much work you get done.

## Purpose

The ticket velocity shows how much work your organisation can deliver over time. The higher the throughput, the more features you generally ship to your customers.

The velocity dashboard also tracks your backlog. If the backlog trend is significantly increasing, then you might get more customer tickets than you can resolve or plan more work than you are able to do.

{% hint style="success" %}
**Improvement Actions**: To increase the ticket velocity, it is helpful to look at the task size. While not all tasks might be under the team's control, such as customer incidents, other tasks might be broken down. It has been shown that smaller tasks lead to overall more work being done.

Other aspects include the amount of interruptions the team has to deal with and the available resourcing. Improving those aspects can also lead to improved velocity.
{% endhint %}

## Explanations

Some of the charts in this report include:

**Ticket throughput**: The number of tickets that were done/closed in the set period of time.

**Lead time**: The lifecycle time from creation to being closed for completed tickets. Shorter lead times often mean smaller tasks and higher throughput. The converse is true as well.

**Contributors**: The number of engineers who were assigned tickets. The more engineers you have the higher throughput one would expect.

**Investment breakdown**: This helps you to gauge where the organisational effort went. By default, the investment of work is defined by the number of tickets resolved with a specific issue type. Depending on the classification in your planning tools, It might indicate if most of the throughput comes from bug tickets or new feature work.

**Backlog trends**: This shows the number of open vs closed tickets over time and the accumulated effect. It indicates the trends of reducing the backlog or if you are having a growth in the backlog and are potentially falling behind.

## Good to Know

Velocity, lead time and code quality be seen as example dimensions for delivery health. One might be able to ship a lot and fast, but with poor quality and many code risks. Conversely, high-quality delivery might be sparse and slow. As such, the Logilica metrics should be seen from a balancing viewpoint.

Similarly, one might ship many items, but overload the [capacity of the team](/metrics-and-reports/planning/ticket-overload) leading to potential burnout issues.


# Ticket Overload

Does your team health suffer from working over capacity and having too ambitious goals?

## Purpose

This report gauges your team's health by comparing it to the industry benchmark on capacity. In particular, it provides insights into the team ticket load and each team member over time.

A high ticket load means having many tickets assigned to a contributor simultaneously. This might lead to overloading that contributor or poor outcomes by juggling too many parallel tasks and potentially slowing down the delivery overall.

{% hint style="success" %}
**Improvement Actions**: For overloaded teams or contributors can be helpful to redistribute some work, reduce the overall load, or add additional resourcing.
{% endhint %}

## Explanations

A team member is regarded as **overloaded** when the number of tickets assigned to them at the same time exceeds a configurable capacity threshold.

**Overloaded Team**: The percentage of team members who were assigned too many tickets at any given moment means they had too many parallel tasks.

**Team Ticketing Health:** The trend of team health. It shows the percentage of the team members that were overloaded as a trend over time. High overloads for sustained periods of time indicate teams that might be generally under-resourced and are under sustained pressure.

**Overloaded Team Members**: Individual contributors who are currently deemed overloaded and have a history of their load. If a contributor has too much on for too long, they risk suffering from burnout and productivity challenges affecting the whole team.

## Good to Know

It is common that at certain times, certain contributors might have too many assigned tickets, but if this affects large parts of the team, then long-term productivity might be at risk, leading to poor delivery results or high talent churn.


# Sprint Health

## Purpose

The sprint overview provides you insights into the general sprint health of your teams and the organisation. It shows interruptions from unplanned work and overall sprint overruns.

{% hint style="success" %}
**Improvement Actions**: If sprints are overrun regularly, it might be helpful to assess the sprint planning or regulate the amount of unplanned/interrupting work coming in.

Similarly, if you have too many interruptions, it might be caused by insufficient planning or the lack of sprint policies.
{% endhint %}

## Explanations

**Sprint Overrun**: The number of tickets that were scheduled in a given sprint, but did not make it to completion in that given sprint. A high percentage indicates an organisation that struggles to schedule complete tasks as planned. Reasons can be manifold, from underspecified tasks to inaccurate estimations or under-resourcing.

**Planned/Unplanned Work**: The number of tickets over time that were added after the sprint's start date as defined in Jira/GitHub Projects etc. Having frequently high levels of unplanned work means more interruptions, potential context switches and less delivery accuracy.

**Sprint Investment**: This shows the breakdown of tickets by their issue types over each sprint cycle as defined in Jira/GitHub Projects etc. It reflects the area where the organisation is investing their time, effort, and resources. Sometimes significant focus shifts are expected, other times it is symptomatic for larger issues such as a flood of bug tickets.

## Good to Know

Sprint Health depends on a number of factors, including planning accuracy, fluctuation of staffing and additional interrupting work. Certain levels of overrun and interruptions often cannot be avoided, but it is worthwhile focussing on the trends here.


# Ticket Activities / Risks

Deep dive into your ticket activities and delivery risks.

## Purpose

This view is for team mangers to see all their relevant ticket activities and risks across teams and boards. Moreover, powerful filtering can be used to slice and dice tickets across the organisation to follow evidence and do quick investigations.

{% hint style="success" %}
**Improvement Actions**: Logilica's pre-computed risk categories help to proactively manage tickets before future problems, such as sprint overruns or delivery delays occur.
{% endhint %}

## Explanations

Some of the information about each ticket in this report includes:

**Lead time**: The ticket lifecycle time from its creation to being closed.

**Breakdown**: The lifecycle breakdown of each ticket showing its time in the Backlog (until being assigned), Pickup (from assignment to in progress) and Resolution (from in progress to done).

**Updated**: The last time the tickets were touched as recorded by Jira etc. This includes all activities recorded by Jira or similar planning tools.

**Status**: Ticket status as defined by Jira/GitHub Projects etc. status.

### Risks

Logilica tracks the number of default risks for each ticket. This includes:

* **Slow Response**: A ticket that has been assigned but has been sitting without progress for an extended period.
* **Unassigned WIP:** A ticket that has been moved to a work-in-progress (WIP) state, but is not assigned to anyone.
* **Long Running WIP**: A ticket that has been in progress for an unusually long time without being closed. This ticket might be stuck or forgotten and likely leads to a sprint overrun.
* **Sprint Overrun**: A ticket that was scheduled for a specific sprint, but did not get completed in the originally scheduled sprint.

## Good to Know

The ticket risks serve as predefined filters and can be combined with other existing or **custom filters**. Behind the *More* button on the filter bar additional complex queries such as below can be easily constructed.

<figure><img src="https://3637178088-files.gitbook.io/~/files/v0/b/gitbook-x-prod.appspot.com/o/spaces%2FvMP8keAdyp2axoLILtL5%2Fuploads%2Fgit-blob-d440725add3915fabe1fcda5096daa4a4770b149%2Fticket%20filters.png?alt=media" alt="" width="246"><figcaption><p>Powerful Ticket Filters</p></figcaption></figure>


# Code

Logilica provides analytics and insights for a number of repository solution including GitHub, GitLab, Bitbucket and Azure DevOps.

For a unified view Logilica uses the term Pull Request (PR) to denote any pull or merge request. Moreover, the following canonical representation of PR stages is used:

<figure><img src="https://3637178088-files.gitbook.io/~/files/v0/b/gitbook-x-prod.appspot.com/o/spaces%2FvMP8keAdyp2axoLILtL5%2Fuploads%2Fgit-blob-9319f77d565822a339e0f8af4227fa641cb5820d%2FPR%20stages.png?alt=media" alt="" width="563"><figcaption></figcaption></figure>

These stages as defined as follows:

* **Development**: from first commit to opening the PR.
* **Response**: from opening the PR to start of a review.
* **Review**: from first review response to approval of the PR.
* **Integration**: from approval of the PR until its merge/closure.


# Code Cycle Time

Track and improve the speed at which you are able to ship code.

## Purpose

Being effective in completing tasks and shipping features depends a lot on the cadence and flow of the development process. One indicator of the development flow is the cycle time of the pull/merge request (PR). The cycle lead time tracks how much time is spent in the different PR stages, such as development, waiting for a review pickup, the review time itself, and merging the PR.

The shorter the cycle time, the more responsive the development team can potentially be.

{% hint style="success" %}
**Improvement Actions**: Long cycle times might result from too large tasks leading to large or complex code commits that in turn, lead to long review and merge times. Large/complex PRs also tend to be picked up for review with greater delays as reviewers need to block out more time.

Other causes can come from underspecified tasks. For this more detailed and broken down planning can help to make improvements. Additionally, improving resource constraints and giving developers fewer parallel activities with less interruptions will help to reduce the overall cycle time.
{% endhint %}

## Explanations

This report tracks the PR lifecycle for teams and repositories. Views can be aggregated across repositories and across teams for a holistic approach. Some of the charts in this report include:

**Code Cycle Time**: The cycle time from the first commit in a PR until it is closed/merged in, i.e., being done.

**Stages**: Breakdown of the cycle time into PR stages of:

* **Development**: time from the first commit to opening the PR.
* **Response**: time from opening the PR to start of a review.
* **Review**: time from first review response to approval of the PR.
* **Integration**: time from approval of the PR until its merge/closure.

**Distribution**: Shows all the PRs clustered into different cycle time buckets. This enables you to quickly identify outliers and investigate why certain PRs might have taken a long time to complete. Common causes can indicate specific work patterns or process problems to be addressed.

**Breakdown by Stage**: Shows the lead time trend over time broken down by PR stages. This gives indications about work pattern consistency and changes in efficiency. It might be that review delays are causing long cycle times or merge problems.

## Good to Know

By default, all the PR stages and activities on them are imported as meta-data from your connected repository providers such as GitHub, GitLab, Bitbucket, Azure DevOps, etc. For consistency Logilica uses the GitHub naming conventions of Pull Requests.


# Coding Velocity

Track and improve how much work you get done.

## Purpose

The coding velocity shows how much work your organisation can deliver over time. The higher the throughput, the more features/PRs you generally ship to your customers.

The velocity dashboard also tracks your PR backlog, i.e., those PRs you open but might not manage to merge/close. If the backlog trend is significantly increasing, you might have a review/approval problem, difficulties merging because of merge conflicts, or a problem with reviewer to developer allocation.

{% hint style="success" %}
**Improvement Actions**: To increase the PR velocity, it is helpful to look at the PR size. It has been shown that smaller, less complex PRs lead to overall more work being done.

Other aspects include the amount of interruptions the team has to deal with and the available resourcing. Having a good time balance between review activities and coding helps to not accumulate larger PR backlogs.
{% endhint %}

## Explanations

Some of the charts in this report include:

**PR throughput**: The number of PRs that were done/closed in the set period of time.

**Cycle time**: The PR lifecycle time from the first commit to merging/closing of completed PRs. Shorter cycle times often mean smaller tasks and higher throughput. The converse is true as well.

**Contributors**: The number of engineers who were opening a PR. The more engineers you have the higher throughput one would expect.

**Work Focus**: The work focus examines the code commits and gives each PR a predominant classification:

* **New Work**: New code that does not change existing code.
* **Rework Own**: Changes to recently written code that the same developer originally committed.
* **Rework Others**: Changes to recently written code that a different developer originally committed.
* **Maintenance**: Changes to older, established code.

The work focus helps you to understand where the organisational effort went into. A certain degree of rework and maintenance is expected. However, if maintenance dominates the throughput, then this is likely caused by technical debt and more extensive refactor needs. This also means that new features are de-prioritised.

**Backlog trends**: This shows the number of open vs closed PRs over time and the accumulated effect. PRs should usually not accumulate any substantial backlog. Reasons for backlog growth might come from forgotten and stale PRs, review delays or merge blockers. More information can be gleaned from Logilica's Code Activity and Risk dashboards.

## Good to Know

Velocity, cycle time and code quality be seen as example dimensions for delivery health. One might be able to ship a lot of PRs fast, but with poor (review) quality and many code risks. Conversely, high-quality delivery might be sparse and slow. As such the Logilica metrics should be seen from a balancing point of view.

Similarly, one might ship many PRs, but overload the [capacity of the team](/metrics-and-reports/code/developer-health) leading to potential burnout issues.


# Review Process

Do you follow proper review processes to ensure delivery quality?

## Purpose

Having effective review and PR merge processes in place helps to create quality deliveries and smooth running teams. The review process dashboard provides a top-level view across teams and repositories to identify PRs that don't follow standard review processes and work that was started but discarded.

{% hint style="success" %}
**Improvement Actions**: Teams who, to a significant degree, are not following the review and approval process might need training. If the process shortcuts are caused by tight deadlines or under-resourcing, some improved planning and resourcing process might be helpful.

As a first step, it is useful to understand the underlying cause. These can be technical, procedural or personal.
{% endhint %}

## Explanations

**Merge Success:** This view shows how much PR work was merged in the selected time period. High levels of merges typically indicate short development cycles and little discarded work. For short time periods, there are more in-flight PRs and lower merge rates are expected.

**Non-Productive Work**: This shows the number of PRs that have been closed without being merged, or have remained open for an extended period without being merged or closed. This might indicate work that was discarded or abandoned and did not end up in the product.

**Merged Outside Process**: This shows the percentage of all PR in the set timeframe that were merged without approval or review. This should be closely examined to ensure ongoing quality of delivery.

**Pull Request Workflow**: This flowchart visualises the journey of each PR through the stages of open, review, approve and merge/closed. If much of the flow bypasses the review and approval stages, then common processes are not followed. If much of the flow bypasses the merge stage, that work is possibly discarded, which might indicate a high level of failed experiments or imprecisely specified work.

## Good to Know

Certain organisations have specific approaches that might invalidate some of the above. This includes the absence of review policies or particular merge/close behaviours. This should be clarified with the respective teams.


# Developer Health

Does your developer team health suffer from working over capacity and having too ambitious goals?

## Purpose

This report gauges your developer team's health by comparing it to the industry benchmark on capacity. In particular, it provides insights into the PR load for teams and each team member over time.

A high PR load means having PR tickets opened and juggled by a contributor simultaneously. This might lead to overloading the developer and poor outcomes due to the many parallel tasks. It can also slow the overall delivery because of context switching and delays.

{% hint style="success" %}
**Improvement Actions**: For overloaded teams or contributors can be helpful to redistribute some work, reduce the overall load, or add additional resourcing.

Another aspect is ensuring smooth review and approval flows, as well as supportive infrastructure such as reliable and fast-build systems.
{% endhint %}

## Explanations

A team member is regarded as **overloaded** when they have an unusually high number of PRs open simultaneously, based on a configurable threshold.

**Overloaded Team:** The percentage of team members with too many PRs open at any given moment means they had too many parallel tasks.

**Team PR Health:** The trend of development team health. It shows the percentage of the team members that were overloaded as a trend over time. High overloads for sustained periods of time indicate teams that might generally be under-resourced and are under sustained pressure.

**Overloaded Developers**: Individual contributors who are currently deemed overloaded and have a history of their load. If a contributor has too much on for too long, they are at risk of suffering from burnout and productivity challenges affecting the whole team.

## Good to Know

It is common that at certain times, specific contributors might have too many open PRs when waiting for reviews or fixes to the build system. However, if this affects large parts of the team, **productivity might be at risk,** leading to poor delivery results or high talent churn.


# Code Activities / Risks

Deep dive into your coding activities and delivery risks.

## Purpose

This view is for team manger to see all the development activities and risks across teams and repositories. Moreover, extensive filtering can be used to slice and dice PRs across the organisation to follow the evidence and do quick investigations to validate standard process issues.

{% hint style="success" %}
**Improvement Actions**: Logilica's pre-computed risk categories help to proactively manage PR processes before future problems, such as quality issues or delivery delays occur.
{% endhint %}

## Explanations

Some of the information about each ticket in this report includes:

**Code Size**: The lines of code committed. While not a measure of productivity, it indicates complexity and effort for reviews, merges, etc. Large commits tend to result more often in delays.

**Work Type**: The predominant type of code changes in the PR — adding new code, reworking recently written code (one's own or others'), or maintaining older, established code.

**Cycle time**: The PR lifecycle time from the first commit to being merged/closed.

**Breakdown**: The lifecycle breakdown of each PR showing its Coding, Response, Review, and Integration time.

**Updated**: The last time the PR was touched as recorded by your git provider.

**Status**: Ticket status as defined by GitHub/GitLab, etc.

### Risks

Logilica tracks the number of default risks for each ticket. This includes:

* **Stale**: A PR that has been open but has not progressed from one stage to the next within a pre-defined time — it may be stuck waiting.
* **Long Running WIP**: A PR that has been open without being merged for an extended period. This PR might be stuck or forgotten.
* **Risky Change:** A PR that potentially deserves more attention because it is unusually large or far-reaching — for example changing a high number of lines, spanning many commits, or touching many files.
* **Complex Review**: A PR that potentially deserves more attention because its review involved unusually high effort — for example a high volume of review comments, multiple review cycles, or several active reviewers.
* **Merged Outside Process**: This identifies PRs that are merged, but did not follow a common quality process and were **not reviewed** or **not approved**.

## Good to Know

The PR risks serve as predefined filters and can be combined with other existing or **custom filters**. Behind the *More* button on the filter bar additional complex queries such as below can be easily constructed.

<figure><img src="https://3637178088-files.gitbook.io/~/files/v0/b/gitbook-x-prod.appspot.com/o/spaces%2FvMP8keAdyp2axoLILtL5%2Fuploads%2Fgit-blob-7c379c54bf821c4ca205fa06d9580cc4662e1242%2FPR%20filters.png?alt=media" alt="" width="374"><figcaption><p>Additional PR filters to slice &#x26; dice</p></figcaption></figure>


# Build

Understand your build bottlenecks and reliability.

## Purpose

Team productivity can be severely impacted by the infrastructure they rely on. This includes build times, reliability, and recovery times. This report provides insights into critical build metrics across pipelines and teams to pinpoint areas of improvement.

{% hint style="success" %}
**Improvement Actions**: Once overall build performance is tracked, it is helpful to tackle those build pipelines that have:

* low reliability,
* a high number of developers depend on them, and
* each individual build might take a long time.

A combination of the above might block contributors in their productivity and also hamper fast, reliable releases. Improving infrastructure speed and reliability leads to higher levels of team happiness and productivity.
{% endhint %}

## Supported CI/CD Platforms

Build data is imported from the following platforms:

| Platform             | How It Connects                                          |
| -------------------- | -------------------------------------------------------- |
| **GitHub Actions**   | Enabled via the GitHub or GitHub Apps connector settings |
| **GitLab Pipelines** | Enabled via the GitLab connector settings                |
| **CircleCI**         | Standalone connector with API Token                      |
| **BuildKite**        | Standalone connector with API Token                      |

You can also push build data from any CI/CD system via the [Import API](/advanced/import/build-data).

## Build Hierarchy

Logilica models CI/CD data in a three-level hierarchy:

* **Pipeline** — the top-level build (e.g., a GitHub Actions workflow run or a GitLab pipeline)
* **Stage** — a grouping of jobs within the pipeline (e.g., a GitHub Actions job or a GitLab stage)
* **Job** — individual steps within a stage

You can drill down from pipeline to stage to job to identify exactly where failures or slowdowns occur.

## Explanations

The build report provides a number of insights, including:

**Total number of builds**: This helps to observe the overall build frequency trend.

**Reliability**: The overall reliability of corresponding pipelines of all selected teams and repositories. Low reliability is known to reduce productivity significantly.

**Build speed**: The time it takes on average for a build. Builds are potential blockers for teams to get their work done, and long build times might slow teams down significantly.

**Recovery time**: The average time it takes for a broken build to recover. Long recovery times potentially block teams for a similar time and might stall releases.

**Build result breakdown**: The success rate and breakdown of builds over time. It shows the trend of improvements or degradation and sometimes the causes for unsuccessful builds.

**Build pipeline table**: The table breaks down each build pipeline into criteria similar to the above. This is a good starting point to identify bottlenecks and unreliable builds.

## DORA Metrics Connection

Build data is the foundation for [DORA metrics](/configuration/dora-configuration). When you configure [Release Detection](/configuration/release-detection), Logilica flags specific builds as deployments and calculates:

* **Deployment Frequency** — how often deployments happen
* **Lead Time for Changes** — time from PR merge to deployment
* **Change Failure Rate** — percentage of deployments that fail
* **Mean Time to Recovery** — how quickly failed builds recover

See [DORA Configuration](/configuration/dora-configuration) for setup details and performance tier benchmarks.

## Good to Know

You can drill down into each pipeline individually to examine the history of the build, its success rate and the stages at which the build has failed.

By default, Logilica imports a history of the last 1000 build runs per repository at the initial onboarding time. Future build runs will be added to the stored history.


# Team Management

The team management pages provide a people-centric view of the organisation. It assists in quickly viewing key metrics across teams, but also to dive deeper to get the pulse of each team and understand what each team member is currently occupied with.


# Teams Overview

How are all your teams tracking?

## Purpose

The teams overview gives you a quick glance at some key statistics for each team and how they are tracking in the aggregate. This report helps you to detect anomalies across teams and allows you to drill down further for investigation. This overview assists you in prioritising when to spend your time and management effort.

{% hint style="success" %}
**Improvement Actions**: Logilica's teams overview helps to get insights across teams. Teams with outlier KPIs might need your help or additional resourcing.
{% endhint %}

## Explanations

Some of the information in this report includes aggregated information such as:

**Active Developers**: The number of engineers who were opening a PR. If the headcount stays the same, you expect a roughly even trend.

**Cycle time**: The PR lifecycle time from the first commit to being merged/closed averaged out across all teams.

**Work Focus**: The predominant type of code changes — adding new code, reworking recently written code (your own or others'), or maintaining older, established code.

**Status**: A badge showing each team's overall standing for the selected period — **Healthy**, **At Risk**, or **Inactive** (no PR activity was recorded for the team in that period).

Besides this, there is a breakdown for each team with statistics including:

**Active Developers**: The number of engineers who were opening a PR.

**WIP**: Work in progress about opening PRs in the reporting period, but not yet merged/closed.

**Done**: Number of PRs closed in the reporting period.

**Cycle time**: The PR lifecycle time from the first commit to being merged/closed.

**Breakdown**: The lifecycle breakdown of each PR showing its Coding, Response, Review, and Integration time.

**Work Activities**: The predominant type of code changes — adding new code, reworking recently written code (your own or others'), or maintaining older, established code.

**Risk**: This counts risks, including:

* **Stale**: A PR that has been opened but did not progress from one stage to another within a pre-defined time.
* **Long Running WIP**: A PR that has been opened but not merged within a pre-defined time. This PR might be stuck or forgotten.
* **Risky Change:** A PR that potentially deserves more attention because it is unusually large or far-reaching — for example changing a high number of lines, spanning many commits, or touching many files.
* **Complex Review**: A PR that potentially deserves more attention because its review involved unusually high effort — for example a high volume of review comments, multiple review cycles, or several active reviewers.
* **Merged Outside Process**: This identifies PRs that are merged, but did not follow a standard quality process and were **not reviewed** or **not approved**.

## Good to Know

A degree of caution should be applied when comparing teams by aggregated numbers. Different teams have likely different work styles and tasks. For instance, backend and frontend teams often have different cadences and a different focus. As such this should be taken as a team performance comparison, but rather to glean signals for follow-up actions.


# Team Pulse

Get a quick understanding what your team is working on and how you are tracking.

## Purpose

The Team Pulse is a team manager's view to stay on top of the team's activity. It shows the most recent progress of your team across tickets and PRs, and highlights some of the risks to delivery as well as team health issues to watch out for. This report also serves as a communication basis with a team to sync on progress and concerns.

{% hint style="success" %}
**Improvement Actions**: The Pulse view highlights a number of delivery risks to watch out for, as well as the load of individual staff. Some level of risk is normal, but unexpected high levels should be investigated. Similarly, if more/less activity in the timeline view is expected, the reasons should be addressed with the team. Some actions might be to change resourcing, set expectations, and distribute workload more effectively.
{% endhint %}

## Explanations

Some of the information in this report includes:

**Cycle time**: The PR lifecycle time from the first commit to being merged/closed averaged out across all teams.

**Work Type**: The predominant type of code changes — adding new code, reworking recently written code (your own or others'), or maintaining older, established code.

**Alerts**: Risk coming out of the [planning stage](/metrics-and-reports/planning/ticket-activities-risks) and the [coding activities](/metrics-and-reports/code/code-activities-risks). This combined view gives a good idea of where to focus the attention and where potential improvement in the process should be made.

**Timeline Ticker**: Shows the most recent activities on both tickets and PRs. An activity is defined as a workflow stage change for the [tickets](/metrics-and-reports/planning) and [PRs](/metrics-and-reports/code) owned by the team.

**Team Overview**: This view shows the activity and load of each team member, including:

* **WIP**: the number of open PRs or assigned tickets to the team member
* **Reviewer**: the number of open PRs the team member is assigned to as a reviewer or made a review comment on
* **Todo**: the number of tickets in the backlog assigned to the team member
* **Done**: the number of tickets closed and PRs closed/merged by the team member
* **Blockers**: the number of items that potentially indicate a team member being blocked. This includes a complex review, long PR response time, long ticket response time, sprint overrun, or unplanned work. See also the [Glossary](/metrics-and-reports/glossary) for details.
* **Load**: the load of each team member is categorised as
  * **available**: no open tickets or PRs
  * **active**: a healthy number of open tickets and PRs
  * **overloaded**: open tickets and PRs combined exceed a pre-defined healthy capacity

## Good to Know

The Pulse view serves as an entry point for a conversation with the team for process improvements. It is not intended as a performance tracker. Note, the timeliness of the data is also affected by the scan frequency as defined by your organisation, which is 24h by default. The advantage of this view is that all the information is computed and aggregated without any overhead by the team itself and creates minimal interruption to their daily activity.


# Activity Lens

Understand what each team member is working on right now.

## Purpose

The activity lens is a team manager's view to be aware of each team member's activity. It shows the most recent **active** items across tickets and PRs, and highlights some of the risks to delivery. This report also serves as a communication basis with team members to sync on progress and concerns.

{% hint style="success" %}
**Improvement Actions**: The activity view helps for direct communication with contributors, being aware of what they are working on, celebrate progress and to address any concerns. Some actions might be to reallocate work across the team, set expectations, and prepare for standup meetings.
{% endhint %}

## Explanations

The activity view includes the most recent progress on **open** items (tickets + PRs). By default a limited history includes items that have been recently **closed** as well. This includes:

* the **PR/ticket description** and link.
* a **timestamp** on the last activity as recorded in the repository/planning tool
* the **duration** of since the ticket has been **assigned** or the since the **first commit of the PR** that is opened
* a **cycle/lead time breakdown** of the different stages up to now
* a **set of risk tags** listing potential delays/risks on tickets and PRs as defined for [their categories](/metrics-and-reports/glossary)
* and the **state** of the ticket/PR

## Good to Know

The activity view serves as an entry point for a conversation with the team and its members for process improvements. It is not intended as a performance tracker. Note, the timeliness of the data is also affected by the scan frequency as defined by your organisation, which is 24h by default.


# Reports

Logilica provides multiple ways to share insights with your team: pre-built reports, weekly email digests, and PDF exports.

## Pre-Built Reports

Logilica comes with a number of pre-defined reports to simplify your organisational reporting. These reports can be selected from the sidebar.

<figure><img src="https://3637178088-files.gitbook.io/~/files/v0/b/gitbook-x-prod.appspot.com/o/spaces%2FvMP8keAdyp2axoLILtL5%2Fuploads%2Fgit-blob-47c41f7e2423a05305dc747faf6c3a535f8e2462%2Freports.png?alt=media" alt=""><figcaption><p>Selection of out-of-the-box reports</p></figcaption></figure>

Reports are conceptually similar to dashboards but may span across many different data sources.

## Weekly Email Reports

Logilica can send a weekly summary email to each user who opts in.

### What's Included

* Summary sections covering successful outcomes, areas for improvement, and recommendations
* Charts selected by the AI to illustrate key findings (when chart rendering is enabled for your organisation)
* Direct links to the relevant dashboards for deeper exploration
* The data time period covered by the report

### How to Enable

1. Navigate to **Settings -> My Account**
2. Find the **Weekly Email Report** toggle
3. Enable it and save

Your timezone is auto-detected from your browser — there is no manual timezone override.

### Tips

* Weekly reports are a good way to stay informed without logging in — useful for managers who want a pulse check without a dashboard session
* If AI summaries appear in the report, they cover the same data as the [AI Insights](/metrics-and-reports/ai-insights) panel on dashboards but in a condensed format
* Each user controls their own subscription — there is no organisation-wide toggle to force email reports on or off

## PDF Export

Any dashboard or report can be exported as a PDF:

1. Navigate to the dashboard you want to export
2. Set your desired filters (time range, team, project) — the PDF captures the current filter state
3. Click the **PDF Export** option from the dashboard menu
4. A preview modal opens showing the rendered PDF
5. Click **Download** in the modal to save the file to your computer

### Tips

* Set filters before exporting — the PDF reflects exactly what's on screen
* Export different filter combinations for different audiences (e.g., one per team for a leadership review)
* All users with dashboard access can export PDFs regardless of their role

## Questions?

If you have particular reporting requirements and would like to help us with defining and adding those, please reach out to our customer success team at <support@logilica.com>.


# AI-Powered Insights

Logilica includes an AI assistant that analyses your dashboard data and explains it in plain English. Instead of interpreting charts yourself, open the AI panel to get a summary you can paste into a Slack message, a retro document, or a stakeholder update.

## How to Use It

1. Open any dashboard in Logilica
2. Click the **sparkle icon** (floating button in the bottom-right corner of the screen) — this opens the AI chat panel
3. The AI immediately generates a **summary of your current dashboard** — this appears automatically
4. Below the summary, you'll see **suggested prompts** — click any of them to get a deeper analysis on that topic
5. The AI analyses the data behind the charts currently shown on the dashboard and streams a response in real time

Each prompt can be used once per session. If you change the dashboard filters (time range, team, project), the AI automatically re-generates a fresh summary based on the updated data.

## Available Prompts

When the AI panel opens, you'll see these prompts after the initial summary:

| Prompt                                                                                                     | What It Does                                                                                                        |
| ---------------------------------------------------------------------------------------------------------- | ------------------------------------------------------------------------------------------------------------------- |
| **"Can you provide me with more details about this dashboard?"**                                           | Gives a deeper breakdown of the data across all chart tiles — trends, comparisons, and notable values               |
| **"Which areas within this data set present the most significant opportunities for improvement?"**         | Identifies metrics that are underperforming or declining, and highlights where the team could focus effort          |
| **"What immediate actions can we take to enhance our team's efficiency, as indicated by this dashboard?"** | Suggests specific, actionable next steps based on what the data shows — bottlenecks to address, processes to adjust |

Each prompt is tailored behind the scenes to produce a detailed, structured response. The label you see is a simplified version — the actual instruction sent to the AI is more specific.

## What the AI Sees

The AI has access to the **data behind the charts on your current dashboard**, including:

* The metric values and trends shown in each chart tile
* The filters you've applied (time range, team, project)
* Table data if the dashboard contains table tiles

The AI analyses the same data you see on screen. It does not access raw code, individual commits, or information beyond what the dashboard displays.

## What the AI Is Good At

* **Summarising** key data points across multiple charts into a single narrative
* **Explaining** what the numbers mean in context — translating metrics into plain English
* **Identifying** areas that need attention — declining trends, outliers, or bottlenecks
* **Suggesting actions** based on the data — concrete next steps rather than abstract observations

## What the AI Doesn't Know

The AI analyses the data shown on your current dashboard — it doesn't have context about your team's circumstances. A cycle time spike might be caused by a holiday week, a team reorg, or a major incident — the AI sees the numbers but doesn't know about these events. You bring the context; the AI brings the data summary.

## Tips

* **Set your dashboard filters before opening the panel** — the AI analyses whatever data is currently shown. Narrow the time range and select the right team first, otherwise the summary may be too broad to be useful
* **Use all three prompts for a complete picture** — the initial summary gives you the overview, "more details" breaks it down, "opportunities" shows where to focus, and "immediate actions" tells you what to do next
* **Copy and paste the output** — AI responses are formatted for sharing. Paste them directly into Slack, a retro doc, or a stakeholder email
* **Change filters to get a different perspective** — switch the team or time range filter and the AI automatically re-generates its summary. Use this to quickly compare different teams or time periods
* **AI summaries also appear in weekly email reports** — if AI insights are enabled for your organisation, the weekly email report includes AI-generated summaries alongside the charts. See [Reports](/metrics-and-reports/reports) for details


# Customization

## Customizing Existing Dashboards

Within the appropriate access rights and Logilica plan, you can completely customize existing dashboards to your requirements and organisational needs.

### Enter editing mode

By clicking the (⋮) on the top of a dashboard, you can enter the editing mode. If you cannot see that option, please contact your workspace administrator or the support team.

<figure><img src="https://3637178088-files.gitbook.io/~/files/v0/b/gitbook-x-prod.appspot.com/o/spaces%2FvMP8keAdyp2axoLILtL5%2Fuploads%2Fgit-blob-0f962212a3206e1fc25cc2f9c29d74f0ddfd6b47%2Fedit%20dashboard.png?alt=media" alt="" width="214"><figcaption><p>Selecting edit mode</p></figcaption></figure>

## Editing options

Once in the editing mode, there are different ways to customize the current dashboard:

* **Rearranging and resizing tiles**: you can drag & drop tiles around and resize them to your liking.
* **Renaming tiles**: simply change chart titles by editing the text.
* **Deleting tiles**: click the trash can icon to delete charts.
* **Editing charts**: click the pencil icon the edit the actual chart content and underlying data query. You will be taken to the [**DataStudio**](/advanced/datastudio-data-model) for that operation.

<figure><img src="https://3637178088-files.gitbook.io/~/files/v0/b/gitbook-x-prod.appspot.com/o/spaces%2FvMP8keAdyp2axoLILtL5%2Fuploads%2Fgit-blob-37fbb8df440a345be0d79b492d4121c2759f1ea0%2FLogilica%20dashboard%20customization.png?alt=media" alt="" width="563"><figcaption><p>Edit view and options</p></figcaption></figure>

### Adding Tiles

Once in editing mode, by clicking the same (⋮) from the top of the dashboard, you will be able to see more menu items, including:

* **Adding charts**: By clicking that option, you can add a new chart from the chart library and include that in the current dashboard.
* **Adding text**: This option allows you to add text boxes with markup for headlines, sections and explanatory text to your dashboard. This also assists you in creating your own report text.

<figure><img src="https://3637178088-files.gitbook.io/~/files/v0/b/gitbook-x-prod.appspot.com/o/spaces%2FvMP8keAdyp2axoLILtL5%2Fuploads%2Fgit-blob-4444232cecbbfe72a18b411b240e3e3728ad5127%2Fadding%20charts.png?alt=media" alt="" width="267"><figcaption><p>Add new charts and text tiles</p></figcaption></figure>

### Saving Edited Dashboards

Use the above menu to exit without saving (**Close**) or to **Save** the modified dashboards. You can also save a new copy (**Save As**) of your modified dashboard.

## Creating New Work Streams, Dashboards and Charts

Within the appropriate access rights and Logilica plan, you can completely extend Logilica by creating your own work streams, dashboards and charts/metrics.

<figure><img src="https://3637178088-files.gitbook.io/~/files/v0/b/gitbook-x-prod.appspot.com/o/spaces%2FvMP8keAdyp2axoLILtL5%2Fuploads%2Fgit-blob-6f0b5388c49573de979559341080c2d8407e1145%2Fnew%20dashboards.png?alt=media" alt="" width="200"><figcaption><p>Extending Logilica</p></figcaption></figure>

By selecting the **Tools** menu on the sidebar, you can manage the **library** of existing elements or add new Work Streams, Dashboards and Charts.

For each of the above, you will be taken to the respective management page. For instance, for **dashboard management,** you can add new dashboards or manage/delete current ones.

Follow the forms to create and manage the respective elements.

<figure><img src="https://3637178088-files.gitbook.io/~/files/v0/b/gitbook-x-prod.appspot.com/o/spaces%2FvMP8keAdyp2axoLILtL5%2Fuploads%2Fgit-blob-e21a025ef865b1d600b856f481097657e15b40c0%2Fdashboard%20library.png?alt=media" alt="" width="563"><figcaption><p>Library and dashboard manager</p></figcaption></figure>

#### Cannot see the Tools menu?

If you cannot see the Tools menu, please contact your workspace administrator for the appropriate access rights or the support team at <support@logilica.com> for further help. Similarly, your account manager will help you with the right plan or additional training and service requirements.


# Glossary

Common terms and definitions used in Logilica.

{% hint style="info" %}
This page is in progress.
{% endhint %}

## Ticket Terms

<table><thead><tr><th width="235">Term</th><th>Definition</th></tr></thead><tbody><tr><td><strong>Backlog</strong></td><td>time span from ticket creation to an assignment to a contributor</td></tr><tr><td><strong>Pickup</strong></td><td>time spans from assignment to a contributor until its status changes to an in-progress stage</td></tr><tr><td><strong>Resolution</strong></td><td>time span from being in-progress until being marked as resolved/done etc.</td></tr><tr><td><strong>Lead Time</strong></td><td>Lifecycle of a ticket from creation to being done</td></tr><tr><td><strong>Throughput</strong></td><td>Number of items processed in time. E.g. number of tickets closed.</td></tr><tr><td><strong>Velocity</strong></td><td>Same as throughput. Often used in VSM/Flow frameworks.</td></tr><tr><td><strong>Capacity</strong></td><td>Throughput in achieving a goal, e.g., number of tickets successfully resolved in a sprint. Sustained achievable outcomes.</td></tr><tr><td><strong>Overloaded</strong></td><td>Beyond a pre-defined capacity. For instance a contributor has more than a certain healthy number of tasks assigned.</td></tr><tr><td><strong>Sprint Overrun</strong></td><td>Defined per ticket. A ticket overruns a sprint if it is not resolved in the initially assigned sprint.</td></tr><tr><td><strong>Unplanned Work</strong></td><td>Defined per ticket. A ticket is unplanned if it is added to a sprint after the initial sprint start date.</td></tr><tr><td><strong>Slow Response</strong></td><td>Defined per ticket. A ticket that has been assigned but has not been moved to in-progress for more than a pre-defined time.</td></tr><tr><td><strong>Unassigned WIP</strong></td><td>Defined per ticket. A ticket that has been moved to a work-in-progress (WIP) state, but is not assigned to anyone</td></tr><tr><td><strong>Long Running WIP</strong></td><td>Defined per ticket. A ticket that has been moved to an in-progress state, but has not been closed in a pre-defined time.</td></tr></tbody></table>

## Code & Pull Request (PR) Terms

<table><thead><tr><th width="235">Term</th><th>Definition</th></tr></thead><tbody><tr><td><strong>Development</strong></td><td>time from first commit to opening the PR</td></tr><tr><td><strong>Response</strong></td><td>time from opening the PR to start of a review</td></tr><tr><td><strong>Review</strong></td><td>time from first review response to approval of the PR</td></tr><tr><td><strong>Integration</strong></td><td>time from approval of the PR until its merge/closure</td></tr><tr><td><strong>Cycle Time</strong></td><td>Lifecycle of a PR from creation to being merged/closed.</td></tr><tr><td><strong>Throughput</strong></td><td>Number of items processed in time. E.g.: number of PRs merged.</td></tr><tr><td><strong>Velocity</strong></td><td>Same as throughput. Often used in VSM/Flow frameworks.</td></tr><tr><td><strong>Capacity</strong></td><td>Throughput in achieving a goal, e.g., number of PRs reviewed in a sprint. Sustained achievable outcomes.</td></tr><tr><td><strong>Overloaded</strong></td><td>Beyond a pre-defined capacity. For instance a contributor has more than a certain healthy number of PRs open in parallel.</td></tr><tr><td><strong>Non-Productive Work</strong></td><td>Defined per PR. A PR that has been opened but does not make it into the product, i.e., gets closed or abandoned without merging.</td></tr><tr><td><strong>Merged Outside Process</strong></td><td>Defined per PR. A PR is merged without being reviewed or approved.</td></tr><tr><td><strong>Stale</strong></td><td>Defined per PR. A PR has been opened but did not progress from one stage to another in a pre-defined time.</td></tr><tr><td><strong>Long Running WIP</strong></td><td>Defined per PR. A PR that has been opened but not merged in a pre-defined time.</td></tr><tr><td><strong>Risky Change</strong></td><td>A pull request flagged for extra attention because it is unusually large or far-reaching — for example, changing a high number of lines, spanning many commits, or touching many files.</td></tr><tr><td><strong>Complex Review</strong></td><td>A pull request flagged for extra attention because its review involved unusually high effort — for example, a high volume of review comments, multiple review cycles, or several active reviewers.</td></tr><tr><td><strong>New Work</strong></td><td>New code being committed that does not change existing code.</td></tr><tr><td><strong>Rework Own</strong></td><td>Changes a developer makes to recently written code that they originally authored.</td></tr><tr><td><strong>Rework Others</strong></td><td>Changes a developer makes to recently written code that was originally authored by someone else.</td></tr><tr><td><strong>Maintenance code</strong></td><td>Changes to older, established code rather than recently written code.</td></tr></tbody></table>

## DORA Terms

<table><thead><tr><th width="235">Term</th><th>Definition</th></tr></thead><tbody><tr><td><strong>Deployment Frequency</strong></td><td>How often a team successfully deploys to production. Higher frequency indicates smaller, more manageable changes.</td></tr><tr><td><strong>Lead Time for Changes</strong></td><td>Time from code committed to code running in production. Measures the efficiency of the delivery pipeline.</td></tr><tr><td><strong>Change Failure Rate</strong></td><td>Percentage of deployments that require immediate intervention (rollbacks or hotfixes). Measures deployment quality.</td></tr><tr><td><strong>Failed Deployment Recovery Time</strong></td><td>Time from a deployment-caused failure to service restoration. Formerly called Mean Time to Recovery (MTTR). Renamed in 2023 to scope specifically to deployment failures.</td></tr><tr><td><strong>Deployment Rework Rate</strong></td><td>Percentage of deployments that are unplanned fixes for production issues. Introduced as the 5th DORA metric in 2024.</td></tr></tbody></table>


# User Management

## What are Users?

Users are individuals of an organisation who have login access to the Logilica platform. These can be separate from [contributors](/configuration/managing-contributors), who contribute to engineering work and whose data is aggregated in the platform.

## Managing Users

Users can be managed by **Organisation Administrators** by navigating to **Settings -> Organisation -> Users**.

Organisation Administrators can invite and add new users, delete existing users or change their access roles.

<figure><img src="https://3637178088-files.gitbook.io/~/files/v0/b/gitbook-x-prod.appspot.com/o/spaces%2FvMP8keAdyp2axoLILtL5%2Fuploads%2Fgit-blob-7297ba00405d96173f2ca742fd1863de8ed472b8%2Fuser_management.jpg?alt=media" alt="" width="563"><figcaption><p>Managing users and roles</p></figcaption></figure>

### Adding Users

New users can be added by providing their name, email and role. The email address will be used for them to activate their account. For security reasons, this invite is only valid for a limited period of time. However, it can be resent if the users do not activate their account within that period.

<figure><img src="https://3637178088-files.gitbook.io/~/files/v0/b/gitbook-x-prod.appspot.com/o/spaces%2FvMP8keAdyp2axoLILtL5%2Fuploads%2Fgit-blob-5184f0f926e2e69d89bf5e74bbfa246d8e579906%2Finvite%20users.png?alt=media" alt="" width="375"><figcaption><p>Inviting new users</p></figcaption></figure>

### Assigning User Roles

Each user is assigned a role relevant to their responsibilities. Roles can be assigned during user creation and changed later through the user management interface.

<figure><img src="https://3637178088-files.gitbook.io/~/files/v0/b/gitbook-x-prod.appspot.com/o/spaces%2FvMP8keAdyp2axoLILtL5%2Fuploads%2Fgit-blob-a37318069afbd4e8b6ab85abb9758c078321f4d4%2Fimage.png?alt=media" alt="" width="375"><figcaption><p>Assigning and changing user roles</p></figcaption></figure>

## Role-Based Access Control

Logilica follows the philosophy of data transparency and at a minimal level gives every invited user **Viewer** access. Data contributors do not have user access unless explicitly invited.

Logilica provides five user-assignable roles:

**Viewers** have read-only access. They can view all dashboards, export reports as PDFs, and access the query API.

**Data Managers** can view users, customise dashboards and charts, manage constant profiles, and access DataStudio.

**Team Leads** have everything Data Managers can do, plus the ability to create and manage teams and assign team members.

**Organisation Administrators** have full control over the domain: managing users, projects, connections, dashboards, API tokens, thresholds, and all organisation-wide settings.

If you require more fine-grained access control, Logilica also supports **custom roles**.

### Custom Roles

Organisation Administrators can create their own custom roles under **Settings -> Organisation -> Custom Roles**. A custom role has a name, an optional description, and an optional **parent role** — a custom role automatically inherits all access its parent role has, so you can build a hierarchy of roles rather than repeating the same permissions on each one.

Once created, a custom role can be assigned to users alongside their standard role, and used to scope access to individual dashboards and charts: when editing a dashboard or chart's access permissions, you can grant visibility to specific users or to everyone holding a given custom role (or a user group built from custom roles), rather than only to the standard role tiers above.

### Access Scopes

<table><thead><tr><th width="234"></th><th width="100" data-type="checkbox">System Admin</th><th width="100" data-type="checkbox">Admin</th><th width="100" data-type="checkbox">Team Lead</th><th width="100" data-type="checkbox">Data Manager</th><th data-type="checkbox">Viewer</th></tr></thead><tbody><tr><td>View dashboards</td><td>true</td><td>true</td><td>true</td><td>true</td><td>true</td></tr><tr><td>Export reports</td><td>true</td><td>true</td><td>true</td><td>true</td><td>true</td></tr><tr><td>Access query API</td><td>true</td><td>true</td><td>true</td><td>true</td><td>true</td></tr><tr><td>DataStudio access</td><td>true</td><td>true</td><td>true</td><td>true</td><td>false</td></tr><tr><td>Manage dashboards</td><td>true</td><td>true</td><td>true</td><td>true</td><td>false</td></tr><tr><td>Manage teams</td><td>true</td><td>true</td><td>true</td><td>false</td><td>false</td></tr><tr><td>Import new data sources</td><td>true</td><td>true</td><td>false</td><td>false</td><td>false</td></tr><tr><td>Set thresholds &#x26; goals</td><td>true</td><td>true</td><td>false</td><td>false</td><td>false</td></tr><tr><td>Create API tokens</td><td>true</td><td>true</td><td>false</td><td>false</td><td>false</td></tr><tr><td>Upload data through API</td><td>true</td><td>true</td><td>false</td><td>false</td><td>false</td></tr><tr><td>Manage user accounts</td><td>true</td><td>true</td><td>false</td><td>false</td><td>false</td></tr><tr><td>Manage organisation settings</td><td>true</td><td>true</td><td>false</td><td>false</td><td>false</td></tr><tr><td>Triage security findings</td><td>true</td><td>false</td><td>false</td><td>false</td><td>false</td></tr><tr><td>Platform-wide system settings</td><td>true</td><td>false</td><td>false</td><td>false</td><td>false</td></tr><tr><td>Advanced connector access</td><td>true</td><td>false</td><td>false</td><td>false</td><td>false</td></tr></tbody></table>


# Managing Contributors

## What are Contributors?

Contributors are all individuals in an organisation who contributed to the data imported into Logilica. For instance, if you connect a repository, anyone who has been active on that repository recently will be counted as a contributor.

## Including / Excluding Contributors

By default, all active contributors' data will be enabled and included in the Logilica platform. However, you can disable **individuals**, **bots** or other accounts you don't want to include.

Contributors can be edited and invited to become full users through "**Settings -> Contributors**".

<figure><img src="https://3637178088-files.gitbook.io/~/files/v0/b/gitbook-x-prod.appspot.com/o/spaces%2FvMP8keAdyp2axoLILtL5%2Fuploads%2Fgit-blob-54f3bde2dfdf72f7ec7c5a56a251582540fc87c6%2Fcontributors.jpg?alt=media" alt="" width="563"><figcaption><p>Managing contributors for data inclusion</p></figcaption></figure>

## Merging Contributor Identities

Contributors are identified by their name and email address. However, sometimes an individual might have several email addresses, an additional GitHub address or similar, resulting in duplication.

Under "**Settings -> Contributors**", duplications can be managed by **merging** several identities into one. Logilica also uses heuristics to identify duplications automatically and to provide **merge suggestions**.

If a suggested merge doesn't apply — for instance two different people who happen to share a similar name — you can dismiss it. Dismissed suggestions are remembered, so Logilica won't keep proposing the same match.


# Menu Management

## Managing Built-in Menu Items

Built-in Menu Items are the first few sections displayed in the Menu Management view. These items cannot be removed from the menu. But, you can toggle the visibility of the individual menu items, including the entire sections, menu groups, or individual items within a menu group.

<figure><img src="https://3637178088-files.gitbook.io/~/files/v0/b/gitbook-x-prod.appspot.com/o/spaces%2FvMP8keAdyp2axoLILtL5%2Fuploads%2Fgit-blob-36770fb52d44ee4bcc03c4e0d4fe1f9acabb6aed%2Fimage%20(3).png?alt=media" alt=""><figcaption><p>Built-in Menu Items</p></figcaption></figure>

## Managing Custom Menu Items

Along with the Built-in Menu Items, you can create and remove your own sections and menu groups. These custom menu items are configured for the entire domain.

<figure><img src="https://3637178088-files.gitbook.io/~/files/v0/b/gitbook-x-prod.appspot.com/o/spaces%2FvMP8keAdyp2axoLILtL5%2Fuploads%2Fgit-blob-299595b7f60c02872e815e7393d9f3843889ad12%2Fimage%20(1)%20(1).png?alt=media" alt=""><figcaption><p>Custom Menu Items</p></figcaption></figure>


# Release Detection

Logilica can track software lifecycle data across different development stages. This includes the tracking of software releases. However, different organisations might have different approaches to defining what constitutes a software release. Logilica supports different release concepts, which you can configure under **Settings -> Organisation -> Release Detection**.

<figure><img src="https://3637178088-files.gitbook.io/~/files/v0/b/gitbook-x-prod.appspot.com/o/spaces%2FvMP8keAdyp2axoLILtL5%2Fuploads%2Fgit-blob-b0aebcc348c7ab86d833d62d04603664f427451d%2Frelease_detection.jpg?alt=media" alt="" width="563"><figcaption></figcaption></figure>

The detection methods include:

* particular build jobs signifying releases,
* merges into a dedicated branch,
* merges of particular PRs/MRs,
* releases marked in your repository system as such.

Detection patterns can be defined as regular expressions. For some tutorials and regular expression testing, you might find some help at sites such as <https://regex101.com/>.


# Targets & Thresholds

While Logilica comes preconfigured with industry best practices and benchmarks for custom settings, Logilica offers an interface to modify and define your own thresholds.

<figure><img src="https://3637178088-files.gitbook.io/~/files/v0/b/gitbook-x-prod.appspot.com/o/spaces%2FvMP8keAdyp2axoLILtL5%2Fuploads%2Fgit-blob-c63362a82dbed08dabd62485cadab88b93b41e72%2Ftargets.png?alt=media" alt="" width="563"><figcaption></figcaption></figure>

You can modify any displayed values or reset them to their original defaults.


# DORA Configuration

DORA (DevOps Research and Assessment) metrics are a widely adopted framework for measuring software delivery performance. Logilica tracks the four core DORA metrics and provides configurable settings to tune how they are calculated for your organisation.

## The Core DORA Metrics

| Metric                              | What It Measures                                        | How Logilica Tracks It                                                                    |
| ----------------------------------- | ------------------------------------------------------- | ----------------------------------------------------------------------------------------- |
| **Deployment Frequency**            | How often your team deploys to production               | Logilica counts detected deployment events over the selected time window                  |
| **Lead Time for Changes**           | Time from code commit to production deployment          | Logilica measures the elapsed time from code commit to the linked production deployment   |
| **Change Failure Rate**             | Percentage of deployments that cause failures           | Logilica computes the share of deployments that result in a failure                       |
| **Failed Deployment Recovery Time** | How quickly your team recovers from deployment failures | Logilica measures how long it takes to restore a healthy deployment state after a failure |

{% hint style="info" %}
The DORA framework continues to evolve. The metric formerly known as "Mean Time to Recovery (MTTR)" was renamed to **Failed Deployment Recovery Time** in 2023 to scope it specifically to deployment-caused failures rather than all service disruptions. The 2024 State of DevOps Report also introduced a fifth metric — **Deployment Rework Rate** (the percentage of deployments that are unplanned fixes for production issues) — and restructured the framework into two categories: Software Delivery Throughput and Software Delivery Stability.
{% endhint %}

## Performance Tiers

Logilica benchmarks your DORA metrics against the following performance tiers:

| Tier       | Deployment Frequency   | Lead Time for Changes | Change Failure Rate | Recovery Time |
| ---------- | ---------------------- | --------------------- | ------------------- | ------------- |
| **Elite**  | Multiple times per day | < 1 hour              | 0–15%               | < 1 hour      |
| **High**   | Daily to weekly        | 1 day – 1 week        | 16–30%              | < 1 day       |
| **Medium** | Weekly to monthly      | 1 week – 1 month      | 16–30%              | < 1 week      |
| **Low**    | Less than monthly      | > 1 month             | 31–45%              | > 1 week      |

{% hint style="info" %}
**About these benchmarks:** DORA performance tiers are derived from annual cluster analysis of survey data — they are not fixed industry thresholds and shift year to year. More recent DORA reports use tighter ranges for some metrics (e.g., Elite Change Failure Rate at 0–5%). The 2025 report moved away from tiers entirely, replacing them with team archetypes based on broader dimensions including well-being and friction. Use the table above as a directional reference for your team's improvement journey, not as a rigid scorecard.
{% endhint %}

## Using DORA Metrics Effectively

DORA metrics are powerful when used correctly, but they come with well-documented risks:

* **Descriptive, not diagnostic.** DORA metrics tell you *how* you're performing, not *why*. A spike in recovery time could be caused by a team reorg, a complex incident, or a tooling change — the metric won't tell you which. Always pair metrics with qualitative context.
* **Avoid making metrics into targets.** The DORA team themselves warn: "making broad statements like 'every application must deploy multiple times per day' increases the likelihood that teams will game the metrics." Focus on trends and improvement, not hitting specific numbers.
* **Don't compare teams on DORA alone.** Different teams have different work types, domain complexity, and release cadences. Cross-team comparisons without context produce unhealthy competition rather than improvement. The DORA team explicitly cautioned against league tables.
* **All four metrics together.** Optimising one metric at the expense of others (e.g., inflating deployment frequency with trivial changes, or reducing change failure rate by deploying nothing) defeats the purpose. The four metrics are designed to balance each other.

## Configuring Deployment Detection

DORA metrics require Logilica to know which events represent production deployments. This is configured through **Release Detection** — see [Release Detection](/configuration/release-detection) for the full setup guide.

Logilica supports four detection methods:

| Method           | How It Works                                                                                                                      |
| ---------------- | --------------------------------------------------------------------------------------------------------------------------------- |
| **Release**      | Detects GitHub or GitLab native release events                                                                                    |
| **Build**        | Matches CI build job names against a regex pattern on a target branch (e.g., build jobs matching `deploy.*` on the `main` branch) |
| **Merge**        | Detects merges into a specific branch matching a regex (e.g., `^production$`)                                                     |
| **Pull Request** | Detects PR merges matching a regex pattern                                                                                        |

Detection patterns are configured at **Settings -> Organisation -> Release Detection** and can also be overridden per-project from individual project settings.

{% hint style="warning" %}
**DORA metrics will be empty if no deployment detection method is configured.** The CI/CD importers import build data but do not automatically determine which builds are deployments — you must configure Release Detection or upload deployment events via the [Import API](/advanced/import/build-data).
{% endhint %}

## DORA Settings

Organisation Administrators can fine-tune DORA calculation parameters at **Settings -> Organisation -> DORA Settings**. This page allows you to adjust platform-level constants that control how Logilica detects production failures and calculates recovery times.

Settings support three levels of precedence:

1. **Platform defaults** — industry-standard values
2. **Organisation overrides** — your domain-specific adjustments
3. **Profile overrides** — team or project-specific tuning

You can reset any override to return to the platform default.

## Viewing DORA Metrics

Once deployment detection is configured and data is flowing, DORA metrics appear in:

* **Build Stability** workstream under the Improve section
* **Build** dashboard under the SDLC section
* **Weekly email reports** (if AI insights are enabled for your organisation)

## Good to Know

* **Recovery time is build-based, not incident-based.** Logilica derives recovery from your CI build history rather than from an incident management system, so it reflects pipeline recovery rather than service-incident MTTR.
* **Humanitec deployments are tracked separately.** If you use the Humanitec connector, deployment data from Humanitec environments feeds into DORA metrics through a dedicated pathway. See [Connecting Tools](/integration/connecting-tools) for Humanitec setup.
* **Historical data matters.** DORA metrics are most useful with several weeks of deployment history. Allow time for enough data to accumulate before drawing conclusions from the trends.
* **AI-generated code can distort DORA signals.** The 2025 State of DevOps Report found that AI adoption improves individual throughput but correlates with increased delivery instability. If your team uses AI coding tools, consider interpreting deployment frequency and change failure rate in the context of your AI code share.


# API Token Management

To access Logilica's data store and interact with the platform through its APIs, we support a token-based access model.

## API Token Generation

To generate and manage tokens navigate to **Settings -> API Tokens** and click on "**Generate New API Token**".

<figure><img src="https://3637178088-files.gitbook.io/~/files/v0/b/gitbook-x-prod.appspot.com/o/spaces%2FvMP8keAdyp2axoLILtL5%2Fuploads%2Fgit-blob-217553b209abc7d1f00f01a263251e8c524332d1%2FAPI%20token%201.png?alt=media" alt=""><figcaption><p>Organisation Settings for API Token</p></figcaption></figure>

## Token Settings

In the token creation process, you need to define the following:

* a name for the token
* an expiration date, and
* a set of scopes.

<figure><img src="https://3637178088-files.gitbook.io/~/files/v0/b/gitbook-x-prod.appspot.com/o/spaces%2FvMP8keAdyp2axoLILtL5%2Fuploads%2Fgit-blob-f14a6b0d34bd83f3bd056c0a497fd98f9dd7b748%2Fapitokenform.png?alt=media" alt="" width="375"><figcaption><p>Setting token scopes</p></figcaption></figure>

The scopes visible to you might depend on your access right. Please get in touch with your administrator if you cannot see the relevant scopes.

## Copy the Generated Token

Once you generate the token, ensure to copy and store it safely.

<figure><img src="https://3637178088-files.gitbook.io/~/files/v0/b/gitbook-x-prod.appspot.com/o/spaces%2FvMP8keAdyp2axoLILtL5%2Fuploads%2Fgit-blob-d2f12007e24a46b482b092690f2d7addaaf58348%2Fmy%20token.png?alt=media" alt="" width="388"><figcaption></figcaption></figure>

{% hint style="warning" %}
**Warning:** for security reasons, you cannot see the token key later.\
If you lose the key, you must generate a new token.
{% endhint %}

## Revoking Tokens

Once tokens have been generated, they can be revoked individually or in bulk.

<figure><img src="https://3637178088-files.gitbook.io/~/files/v0/b/gitbook-x-prod.appspot.com/o/spaces%2FvMP8keAdyp2axoLILtL5%2Fuploads%2Fgit-blob-204656c780ea556b104b91109be4d974c4f0ba67%2Ftoken%20done.png?alt=media" alt=""><figcaption></figcaption></figure>


# Platform MCP Server

Ask questions about your engineering data in plain English, straight from an AI assistant. The Platform MCP server gives your assistant read-only access to your Logilica analytics: it finds the right metric, runs the query, and answers with real numbers from your data.

It is hosted as part of your Logilica platform, so there is nothing to install. Create an API token, point your client at it, and start asking.

<figure><img src="https://3637178088-files.gitbook.io/~/files/v0/b/gitbook-x-prod.appspot.com/o/spaces%2FvMP8keAdyp2axoLILtL5%2Fuploads%2Fgit-blob-e0c4a00819a0f75c136a5baacc70af7d89690a10%2Fplatform-mcp-flow.svg?alt=media" alt="Your AI assistant sends questions to Logilica&#x27;s /api/mcp endpoint, which runs read-only queries against the same analytics your dashboards use"><figcaption><p>Your assistant asks; Logilica answers from your own analytics</p></figcaption></figure>

## What you can ask

Questions map to the same metrics your dashboards use. Some examples:

| Category  | Example questions                                                                                    |
| --------- | ---------------------------------------------------------------------------------------------------- |
| Delivery  | "How many pull requests did we merge last quarter?", "Which repository has the most open PRs?"       |
| Speed     | "What is our average PR cycle time this year?", "How long does a PR take to get its first review?"   |
| CI health | "What is our build failure rate this month?", "Which builds fail most often?"                        |
| Trends    | "Give me a weekly engineering summary", "How does this month's commit volume compare to last month?" |
| Security  | "How many open vulnerabilities do we have?"                                                          |

## Before you start

You need a Logilica API token. Any role can use the MCP server with one, from **Viewer** upwards, but only an **Organisation Administrator** can create tokens. See [API Token Management](/advanced/api-tokens) to create one, or ask your administrator for a token.

## Connect your MCP client

The connection details are the same for every client:

|           |                                                                                |
| --------- | ------------------------------------------------------------------------------ |
| Endpoint  | `https://logilica.io/api/mcp`                                                  |
| Transport | Streamable HTTP                                                                |
| Auth      | Two headers: `X-lgca-token` (your API token) and `X-lgca-domain` (your domain) |

**Claude Desktop (and other JSON-configured clients)**

Use the configuration below. For Claude Desktop, open **Settings → Developer → Edit Config** and add it there. The connection uses the [`mcp-remote`](https://www.npmjs.com/package/mcp-remote) package.

```json
{
  "mcpServers": {
    "logilica": {
      "command": "npx",
      "args": [
        "mcp-remote",
        "https://logilica.io/api/mcp",
        "--header",
        "X-lgca-token:${LGCA_TOKEN}",
        "--header",
        "X-lgca-domain:${LGCA_DOMAIN}"
      ],
      "env": {
        "LGCA_TOKEN": "your-api-token",
        "LGCA_DOMAIN": "your-domain"
      }
    }
  }
}
```

Restart Claude Desktop, and Logilica appears in its tool list. Keep the credentials in `env` and the headers without a space after the colon - some clients mangle spaces inside arguments.

{% hint style="info" %}
`mcp-remote` runs through `npx`, so it needs Node.js 20.18 or newer installed.
{% endhint %}

**Claude Code (CLI)**

Claude Code sends headers directly, so it needs no bridge:

```bash
claude mcp add --transport http logilica https://logilica.io/api/mcp \
  --header "X-lgca-token: <token>" \
  --header "X-lgca-domain: <domain>"
```

Run `/mcp` to confirm `logilica` shows as Connected. If the client offers to "authenticate", skip it: this server uses header authentication, not OAuth.

## Try it

Ask your assistant a question in plain English:

```
How many pull requests did we merge in the last 30 days?
```

It picks the metric, queries your data, and answers with the numbers and the exact window they cover - no dashboard needed.

## Good to know

* Results always state the time window they cover. Ask about a period and leave the dates open, and the last 30 days is used; ask with no time frame at all and the answer covers all your data - so say "this month" or "last quarter" when you mean it.
* Large results are capped and flagged as partial, so answers stay focused. Ask for aggregates rather than raw listings.
* If a metric does not exist for your domain, the assistant is told so directly, rather than being given room to guess.

## Troubleshooting

| Symptom                                                          | Cause                                                 | Fix                                                         |
| ---------------------------------------------------------------- | ----------------------------------------------------- | ----------------------------------------------------------- |
| `Missing X-lgca-token / X-lgca-domain headers`                   | Headers not sent                                      | Check the header configuration in your client               |
| `Invalid or expired combination of X-lgca-token + X-lgca-domain` | Wrong token type, or the token expired or was revoked | Create a fresh API token, or ask your administrator for one |
| Answers come back as zero                                        | The question's time window has no data                | Widen or shift the date range in your question              |


# Import API


# API Overview

The Logilica platform ingests, analyses and displays insights based on the data from the software development lifecycle tools (SDLC) you connected. Logilica supports many common SDLC products through first class connectors as explained in the integration and onboarding pages.

To support less common SDLC products, accommodate internal access control restrictions and support in-house tools Logilica offers a **REST API** to push data into the platform through **POST** commands.

{% hint style="info" %}
Note: You need to set up an [API token](/advanced/api-tokens) first to make use of the REST API.
{% endhint %}


# Uploading Planning Data

## Upload Example Using cURL

In the following, we provide an example of how to push your Planning data to Logilica for storage and built-in analytics. The following depicts all possible fields that can be included in an upload of a ticket or issue, both the mandatory and optional fields.

The cURL POST command is below. Note, that the POST command includes the example API token `lgca_UeRxFs_3RYRJEJtdYp7j7Wa6DirG5NjiYslsb` and the example workspace `myworkspace`. The command URL also includes a placeholder for the projectID to associate the uploaded issues with. This projectID is obtained from the `pm/projects/create` endpoint.

```
curl --location --request POST \
'https://logilica.io/api/import/v1/pm/<projectID>/issues/create' \
--header 'X-lgca-token: lgca_UeRxFs_3RYRJEJtdYp7j7Wa6DirG5NjiYslsb' \
--header 'x-lgca-domain: myworkspace' \
--header 'Content-Type: application/json' \
--data-raw '[{
    "id": "ABC-123",
    "origin": "JIRA",
    "createdAt": 1689207410,
    "updatedAt": 1689309835,
    "creator": {
        "name": "John Doe",
        "email": "john.doe@myorganisation.com",
        "accountId": "johnDoe",
        "lastActivity": 1701436893
    },
    "reporter": {
        "name": "Jane Doe",
        "email": "jane.doe@myorganisation.com",
        "accountId": "janeDoe",
        "lastActivity": 1699536093
    },
    "assignedAt": 1689207463,
    "assignee": {
        "name": "Sally Smith",
        "email": "sally.smith@myorganisation.com",
        "accountId": "sallySmith",
        "lastActivity": 1701091293
    },
    "inProgressAt": 1689207487,
    "resolvedAt": 1689309835,
    "resolver": {
        "name": "Sally Smith",
        "email": "sally.smith@myorganisation.com",
        "accountId": "sallySmith",
        "lastActivity": 1701436893
    },
    "resolution": "Fix",
    "type": "Task",
    "status": "Completed",
    "statusCategory": "Done",
    "summary": "Revive user API endpoints in each service.",
    "description": "Go into each service and enable the API endpoints that both upload and import user data.",
    "url": "https://myworkspacename.atlassian.net/browse/ABC-123",
    "labels": ["backend"],
    "sprintKeys": ["456"],
    "priority": "Low",
    "storyPointEstimate": 1,
    "parentIssue": "ABC-789",
    "events": [
        {
            "type": "PM_ISSUE_CREATED",
            "author": {
                "name": "John Doe",
                "email": "john.doe@myorganisation.com",
                "accountId": "johnDoe",
                "lastActivity": 1701436893
            },
            "createdAt": 1689207410,
            "to": ""
        },
        {
            "type": "PM_ISSUE_ASSIGNED",
            "author": {
                "name": "John Doe",
                "email": "john.doe@myorganisation.com",
                "accountId": "johnDoe",
                "lastActivity": 1701436893
            },
            "createdAt": 1689207463,
            "to": {
                "name": "Sally Smith",
                "email": "sally.smith@myorganisation.com",
                "accountId": "sallySmith",
                "lastActivity": 1701091293
            }
        },
        {
            "type": "PM_ISSUE_IN_PROGRESS",
            "author": {
               "name": "Sally Smith",
                "email": "sally.smith@myorganisation.com",
                "accountId": "sallySmith",
                "lastActivity": 1701091293
            },
            "createdAt": 1689207487,
            "from": "To Do",
            "to": "In Progress"
        },
        {
            "type": "PM_ISSUE_RESOLVED",
            "author": {
               "name": "Sally Smith",
                "email": "sally.smith@myorganisation.com",
                "accountId": "sallySmith",
                "lastActivity": 1701091293
            },
            "createdAt": 1689309835,
            "from": "In Progress",
            "to": "Done"
        }
    ]
}]'
```

## Method of Importing Planning Data

To ensure the accuracy of data in Logilica, planning data should be imported in the following order:

1. Create a project and fetch the ID returned to you. You use this ID in subsequent calls to the Logilica Import API for Planning Data.
2. Import or update sprints
3. Import or update issues

Data is displayed in Logilica once issues have been imported.

## API Schema for Importing Planning Data

### Create a new project

{% openapi src="/files/H2K3YSOSvLkeTJqrV3HE" path="pm/projects/create" method="post" %}
[openapi.json](https://3637178088-files.gitbook.io/~/files/v0/b/gitbook-x-prod.appspot.com/o/spaces%2FvMP8keAdyp2axoLILtL5%2Fuploads%2Fgit-blob-d8a87b720df94b60e4756c4b7d2c1bfce151c6a1%2Fopenapi.json?alt=media)
{% endopenapi %}

### Add or Update Sprints

{% openapi src="/files/H2K3YSOSvLkeTJqrV3HE" path="pm/{projectID}/sprints" method="post" %}
[openapi.json](https://3637178088-files.gitbook.io/~/files/v0/b/gitbook-x-prod.appspot.com/o/spaces%2FvMP8keAdyp2axoLILtL5%2Fuploads%2Fgit-blob-d8a87b720df94b60e4756c4b7d2c1bfce151c6a1%2Fopenapi.json?alt=media)
{% endopenapi %}

### Add or Update Issues

{% openapi src="/files/H2K3YSOSvLkeTJqrV3HE" path="pm/{projectID}/issues/create" method="post" %}
[openapi.json](https://3637178088-files.gitbook.io/~/files/v0/b/gitbook-x-prod.appspot.com/o/spaces%2FvMP8keAdyp2axoLILtL5%2Fuploads%2Fgit-blob-d8a87b720df94b60e4756c4b7d2c1bfce151c6a1%2Fopenapi.json?alt=media)
{% endopenapi %}


# Uploading CI Build Data

## Upload Example Using cURL

In the following, we provide an example of how to push your build-run information to Logilica for storage and built-in analytics.

{% hint style="info" %}
**Important**: Ensure the repository you build from is already **onboarded** in Logilica.

The [Repositories API](/advanced/import/repositories) can be used to retrieve the `repoId` for the endpoint.
{% endhint %}

The cURL POST command is below. Note, that the POST command includes the example API token `lgca_UeRxFs_3RYRJEJtdYp7j7Wa6DirG5NjiYslsb` and the example workspace `myworkspace`. The command URL also includes a placeholder for the repoID to associate the uploaded issues with.

```curl
curl --location --request POST 'https://logilica.io/api/import/v1/ci_build/<repoID>/create' \
--header 'X-lgca-token: lgca_UeRxFs_3RYRJEJtdYp7j7Wa6DirG5NjiYslsb' \
--header 'x-lgca-domain: myworkspace' \
--header 'Content-Type: application/json' \
--data-raw '[{
  "origin": "GITHUB_TEST",
  "originalID": "1691121120",
  "name": "Pull Request CI",
  "url": "https://github.com/logilica/example/actions/runs/1691121120",
  "createdAt": 1689207410,
  "startedAt": 1689208510,
  "completedAt": 1689209716,
  "triggeredBy": {
    "name": "Joe Doe",
    "email": "jdoe@example.com",
    "accountId": "joe-doe",
    "lastActivity": 1679528275
  },
  "status": "completed",
  "conclusion": "success",
  "repoUrl" : "https://github.com/logilica/example",
  "commit": "c3de81aedf8461324021d61f4dca16dd742db215",
  "pullRequestUrls": [],
  "isDeployment": false,
  "stages": [
    {
      "id" : "4799033011",
      "name": "build / Build Logilica Insights",
      "startedAt": 1689208510,
      "completedAt": 1689209716,
      "status": "completed",
      "conclusion": "success",
      "url": "https://github.com/logilica/example/runs/4799033011?check_suite_focus=true",
      "jobs": [
        {
          "startedAt": 1689208510,
          "completedAt": 1689208540,
          "name": "Set up job",
          "status": "completed",
          "conclusion": "success"
        },
        {
          "startedAt": 1689208545,
          "completedAt": 1689209716,
          "name": "Run actions/checkout@v2",
          "status": "completed",
          "conclusion": "success"
        }
      ]
    }
  ]
}]'
```

## API Schema for Importing CI Build Data

{% openapi src="/files/H2K3YSOSvLkeTJqrV3HE" path="ci\_build/{repoID}/create" method="post" %}
[openapi.json](https://3637178088-files.gitbook.io/~/files/v0/b/gitbook-x-prod.appspot.com/o/spaces%2FvMP8keAdyp2axoLILtL5%2Fuploads%2Fgit-blob-d8a87b720df94b60e4756c4b7d2c1bfce151c6a1%2Fopenapi.json?alt=media)
{% endopenapi %}

## Questions?

If you have any questions or run into issues, please contact us at <support@logilica.com>.


# CDEvents Integration

Uploading CI Builds to Logilica using CDEvents

CDEvents (Continuous Delivery Events) is a **standardized event format** for event-driven communication in CI/CD and DevOps systems. Designed to work with platforms like Tekton, Jenkins, ArgoCD, Flux, and other modern DevOps frameworks.

For further details on CDEvents, refer to the official [CDEvents Specification](https://cdevents.dev/).

## Importing CDEvents Build Data

{% hint style="info" %}
Before using this API, ensure that your CI/CD tooling is configured to emit **CDEvents**.
{% endhint %}

To ensure the accuracy of data in Logilica, CDEvents data should adhere to the following guide:

1. Import a repository to Logilica and fetch the `ID` through the API or UI. You use this `ID` in subsequent calls to the Logilica Import API for CDEvents Data.
2. Send CDEvents to the API. The API expects events in chronological order.

In Logilica, a CI build data entry is constructed across the ingestion of multiple CDEvents events. The creation of the complete CI build entry is triggered when an event with a type of `dev.cdevents.pipelinerun.finished` is received. Partial CI build entry records are not shown in the Logilica UI. The `context.id` field is used across the multiple CDEvent events to create one CI build entry in Logilica.

### Mapping of CDEvents to Logilica CI Build <a href="#upload-example-using-curl" id="upload-example-using-curl"></a>

The following table outlines how CDEvents are mapped to the attributes of [CI builds in Logilica](/advanced/import/build-data#ci_build-repoid-create). Each event contributes specific data that is aggregated to form a complete build record

<table><thead><tr><th width="217">Logilica CI Build</th><th width="269">CDEvent Type</th><th>CDEvent Field</th></tr></thead><tbody><tr><td>name</td><td>pipelinerun</td><td>pipelineName</td></tr><tr><td>url</td><td>pipelinerun</td><td>outcome</td></tr><tr><td>startedAt</td><td>pipelinerun</td><td>timestamp and type includes 'running'</td></tr><tr><td>createdAt</td><td>pipelinerun</td><td>timestamp and type includes 'queued'</td></tr><tr><td>completedAt</td><td>pipelinerun</td><td>timestamp and type includes 'completed'</td></tr><tr><td>stages</td><td>build</td><td>id, timestamp</td></tr><tr><td>repoUrl</td><td>repository</td><td>url</td></tr><tr><td>commit</td><td>change</td><td>id</td></tr><tr><td>triggeredBy</td><td>customData</td><td></td></tr><tr><td>pullRequestUrls</td><td>customData</td><td></td></tr></tbody></table>

In addition, Logilica's CDEvents integration supports the additional fields of `triggeredBy` and `pullRequestUrls` through the use of custom data field, specified in a **JSON string format** (refer to cURL example below).

{% hint style="info" %}
**Using custom data** requires the CDEvents to have `customDataContentType: "application/json"`
{% endhint %}

### Upload Example Using cURL <a href="#upload-example-using-curl" id="upload-example-using-curl"></a>

In the following, we provide an example of how to push your CDEvents data into Logilica for storage and built-in analytics.

{% hint style="info" %}
**Important**: Ensure the repository you build from is already **onboarded** in Logilica.\
The [Repositories API](/advanced/import/repositories) can be used to retrieve the `repoId` for the endpoint.
{% endhint %}

The cURL POST command has been provided below. Note, that the POST command uses example data, including the API token `lgca_UeRxFs_3RYRJEJtdYp7j7Wa6DirG5NjiYslsb` and the example workspace `myworkspace`. The command URL also includes a placeholder for the repoID to associate the uploaded CD Events with.

```
curl -L \
  --request POST \
  --url 'https://logilica.io/api/import/v1/cd_events/<repoID>/create' \
  --header 'X-lgca-token: lgca_UeRxFs_3RYRJEJtdYp7j7Wa6DirG5NjiYslsb' \
  --header 'x-lgca-domain: myworkspace' \
  --header 'Content-Type: application/json' \
  --data '{  
    "context": {
        "version": "0.1.2",
        "id": "event-123",
        "source": "/event/source/123",
        "type": "dev.cdevents.pipelinerun.finished",
        "timestamp": "2025-03-05T10:00:00Z"
    },
    "subject": {
        "id": "pipeline-123",
        "source": "/event/source/123",
        "type": "pipelineRun",
        "content": {
            "id": "pipeline-123",
            "source": "/event/source/123"",
            "type": "dev.cdevents.build.finished",
            "pipelineName": "example-pipeline",
            "url": "https://ci.example.com/pipeline/67890",
            "outcome": "success"
        }
    },
    "customData": "{\"triggeredBy\": \"John Doe\", \"pullRequestUrls\": [\"https://github.com/org/pull/123"]}",
    "customDataContentType": "application/json"
}'
```

## API Schema for Importing CDEvents

### Create a CDEvent

{% openapi src="/files/H2K3YSOSvLkeTJqrV3HE" path="cd\_events/{repoID}/create" method="post" %}
[openapi.json](https://3637178088-files.gitbook.io/~/files/v0/b/gitbook-x-prod.appspot.com/o/spaces%2FvMP8keAdyp2axoLILtL5%2Fuploads%2Fgit-blob-d8a87b720df94b60e4756c4b7d2c1bfce151c6a1%2Fopenapi.json?alt=media)
{% endopenapi %}


# Uploading Test Data

## Upload Example Using cURL

In the following, we provide an example of how to push your Test data into Logilica for storage and built-in analytics.

{% hint style="info" %}
**Important**: Ensure the repository you build from is already **onboarded** in Logilica.

The [Repositories API](/advanced/import/repositories) can be used to retrieve the `repoId` for the endpoint.
{% endhint %}

The cURL POST command is below. Note, that the POST command includes the example API token `lgca_UeRxFs_3RYRJEJtdYp7j7Wa6DirG5NjiYslsb` and the example workspace `myworkspace`. The command URL also includes a placeholder for the repoID to associate the uploaded issues with.

{% code fullWidth="false" %}

```curl
curl --location --request POST 'https://logilica.io/api/import/v1/coverage/<repoID>/test_run/create' \
--header 'X-lgca-token: lgca_UeRxFs_3RYRJEJtdYp7j7Wa6DirG5NjiYslsb' \
--header 'x-lgca-domain: myworkspace' \
--header 'Content-Type: application/json' \
--data-raw '[
    {
        "id": "123",
        "testID": "test1",
        "commitHash": "8c39c46e512541fd9431fad3109cfab1816cfdbb",
        "branch": "master",
        "name": "Test Run 1",
        "outcome": "success",
        "outcomeCategory": "Pass",
        "duration": 1234567890,
        "timestamp": 1738813508,
        "additionalFields": [
            {
                "key": "type",
                "value": "unit"
            },
            {
                "key": "foor",
                "value": "bar"
            }
        ],
        "pullRequest": "1357"
    },
    {
        "id": "456",
        "testID": "test2",
        "commitHash": "qdbjtecjed35b9d5d5bb2854e908c5a29edfcd61",
        "branch": "master",
        "name": "Test Run 2",
        "outcome": "failed",
        "outcomeCategory": "Failure",
        "duration": 1234567890,
        "timestamp": 1738813508,
        "additionalFields": [
            {
                "key": "type",
                "value": "integration"
            }
        ],
        "pullRequest": "2468"
    }
]'
```

{% endcode %}

## API Schema for Importing Test Data

{% openapi src="/files/H2K3YSOSvLkeTJqrV3HE" path="coverage/{repoID}/test\_result/create" method="post" %}
[openapi.json](https://3637178088-files.gitbook.io/~/files/v0/b/gitbook-x-prod.appspot.com/o/spaces%2FvMP8keAdyp2axoLILtL5%2Fuploads%2Fgit-blob-d8a87b720df94b60e4756c4b7d2c1bfce151c6a1%2Fopenapi.json?alt=media)
{% endopenapi %}

{% openapi src="/files/H2K3YSOSvLkeTJqrV3HE" path="coverage/{repoID}/commit/create" method="post" %}
[openapi.json](https://3637178088-files.gitbook.io/~/files/v0/b/gitbook-x-prod.appspot.com/o/spaces%2FvMP8keAdyp2axoLILtL5%2Fuploads%2Fgit-blob-d8a87b720df94b60e4756c4b7d2c1bfce151c6a1%2Fopenapi.json?alt=media)
{% endopenapi %}

## Questions?

If you have any questions or run into issues, please contact us at <support@logilica.com>.


# Uploading Team Data (beta)

Teams are groups of contributors that can collaborate and are managed collectively. These APIs allow you to set up and manage your teams on your domain.

## Importing Teams Data

{% hint style="info" %}
**Important**: Ensure your [API token](/advanced/api-tokens) has the `manage:team` scope when calling Teams APIs.
{% endhint %}

To ensure the accuracy of data in Logilica, Teams data should adhere to the following:

* Teams should have unique names.
* New members will automatically be added as contributors into your Logilica instance.
* The administrator of the team is assigned to the owner of the API token.
* For parent teams, include the `subTeams` field and use the GET Teams API to obtain the team's `ID`.

### Upload Example Using cURL

In the following, we provide an example of how to push your Teams data into Logilica for storage and built-in analytics.

{% hint style="info" %}
**Important**: Ensure the repository you build from is already **onboarded** in Logilica.
{% endhint %}

The cURL POST command is below. Note, that the POST command uses example data, including the API token `lgca_UeRxFs_3RYRJEJtdYp7j7Wa6DirG5NjiYslsb` and the example workspace `myworkspace`.

```
curl --location --request POST 'https://logilica.io/api/import/v1/teams/create' \
--header 'X-lgca-token: lgca_UeRxFs_3RYRJEJtdYp7j7Wa6DirG5NjiYslsb' \
--header 'x-lgca-domain: myworkspace' \
--header 'Content-Type: application/json' \
--data-raw '{
    "name": "Development Team",
    "members": [{
        "name": "John Doe",
        "email": "john.doe@org.com"
    },
    {
        "name": "Jane Doe,
        "email": "jane.doe@org.com"
    }],
    "subTeams": ["1234567"]
}'
```

## API Schema for Importing Team

### Create a Team

{% openapi src="/files/H2K3YSOSvLkeTJqrV3HE" path="teams/create" method="post" %}
[openapi.json](https://3637178088-files.gitbook.io/~/files/v0/b/gitbook-x-prod.appspot.com/o/spaces%2FvMP8keAdyp2axoLILtL5%2Fuploads%2Fgit-blob-d8a87b720df94b60e4756c4b7d2c1bfce151c6a1%2Fopenapi.json?alt=media)
{% endopenapi %}

### Update a Team

{% openapi src="/files/H2K3YSOSvLkeTJqrV3HE" path="teams/update/{teamID}" method="post" %}
[openapi.json](https://3637178088-files.gitbook.io/~/files/v0/b/gitbook-x-prod.appspot.com/o/spaces%2FvMP8keAdyp2axoLILtL5%2Fuploads%2Fgit-blob-d8a87b720df94b60e4756c4b7d2c1bfce151c6a1%2Fopenapi.json?alt=media)
{% endopenapi %}

### Delete a Team

{% openapi src="/files/H2K3YSOSvLkeTJqrV3HE" path="teams/delete/{teamID}" method="post" %}
[openapi.json](https://3637178088-files.gitbook.io/~/files/v0/b/gitbook-x-prod.appspot.com/o/spaces%2FvMP8keAdyp2axoLILtL5%2Fuploads%2Fgit-blob-d8a87b720df94b60e4756c4b7d2c1bfce151c6a1%2Fopenapi.json?alt=media)
{% endopenapi %}

### List Teams

{% openapi src="/files/H2K3YSOSvLkeTJqrV3HE" path="teams/" method="get" %}
[openapi.json](https://3637178088-files.gitbook.io/~/files/v0/b/gitbook-x-prod.appspot.com/o/spaces%2FvMP8keAdyp2axoLILtL5%2Fuploads%2Fgit-blob-d8a87b720df94b60e4756c4b7d2c1bfce151c6a1%2Fopenapi.json?alt=media)
{% endopenapi %}


# Repositories

The repositories for a domain and its details can be retrieved using this API.

The `id` of the repository is used by [CI build-related APIs](/advanced/import/build-data).

## API Schema for Repositories

### Get Repositories

{% openapi src="/files/H2K3YSOSvLkeTJqrV3HE" path="repositories" method="get" %}
[openapi.json](https://3637178088-files.gitbook.io/~/files/v0/b/gitbook-x-prod.appspot.com/o/spaces%2FvMP8keAdyp2axoLILtL5%2Fuploads%2Fgit-blob-d8a87b720df94b60e4756c4b7d2c1bfce151c6a1%2Fopenapi.json?alt=media)
{% endopenapi %}


# Uploading Contributors Data

Contributors are individuals linked across third-party accounts (e.g. GitHub, Jira and others) whose activity is explored in Logilica. The platform allows you to merge and manage these identities to provide a unified view of contributor activity across tools.

These APIs allow you to set up, manage and view your contributors and their accounts on your domain.

## Importing Contributors Data

When creating contributors using the `/create` API, the associated accounts of the user from the body request will be strictly reflected in Logilica. Accounts will be merged or unmerged with contributors, depending on the body's request.

To ensure the accuracy of data in Logilica, Contributors data should adhere to the following:

* The `service` field should be one of the accepted services. The accepted services are:

  ```
  GitHub, GitLab, Git, Jira, AzureDevops, BitBucket, CircleCi, CodeCov, BuildKite
  ```
* If the target contributor does not exist, a new contributor will be added to the domain.
* If the contributor's account does not have an email, an empty string `email: ""` can be entered as a placeholder.

{% hint style="info" %}
Valid accounts must be linked to imported services in the Logilica platform. Please import the services linked to the account first, before adding the account to the user.
{% endhint %}

### Upload Example Using cURL <a href="#upload-example-using-curl" id="upload-example-using-curl"></a>

The cURL POST command is below. Note, that the POST command uses example data, including the API token `lgca_UeRxFs_3RYRJEJtdYp7j7Wa6DirG5NjiYslsb` and the example workspace `myworkspace`.

```
curl --location --request POST 'https://logilica.io/api/import/v1/contributors/create' \
--header 'X-lgca-token: lgca_UeRxFs_3RYRJEJtdYp7j7Wa6DirG5NjiYslsb' \
--header 'x-lgca-domain: myworkspace' \
--header 'Content-Type: application/json' \
--data-raw '[{
    "name": "John Doe",
    "email": "johndoe@test.com",
    "accounts": [{
        "service": "GitHub",
        "username": "johndoe",
        "email": "johndoe@github.com"
    },
    {
        "service": "Jira",
        "username": "johndoe@test.com",
        "email": "johndoe@test.com"
    }]
}]'
```

## API Schema for Contributors

### Create Contributors

## POST contributors/create

> Create or merge contributors with third party accounts

```json
{"openapi":"3.0.0","info":{"title":"Issues API","version":"1.0.0"},"servers":[{"url":"https://logilica.io/api/import/v1/"}],"paths":{"contributors/create":{"post":{"description":"Create or merge contributors with third party accounts","requestBody":{"content":{"application/json":{"schema":{"type":"array","items":{"type":"object","properties":{"name":{"type":"string","description":"The full name of the contributor"},"email":{"type":"string","description":"The email address of the contributor"},"accounts":{"type":"array","items":{"type":"object","properties":{"service":{"type":"string","enum":["GitHub","GitLab","Git","Jira","AzureDevops","BitBucket","CircleCi","CodeCov","BuildKite"],"description":"The external service this account is linked to, such as 'GitHub' or 'Jira'"},"username":{"type":"string","description":"The username for this account"},"email":{"type":"string","description":"The email address linked to this account"}},"required":["service","username","email"]},"description":"A list of connected external accounts (e.g. 'GitHub' or 'Jira') associated with the contributor."}},"required":["name","email","accounts"]}}}}},"responses":{"200":{"description":"Success","content":{"application/json":{"schema":{"type":"object","properties":{"message":{"type":"string"}},"required":["message"]}}}},"400":{"description":"Data given doesn't match schema. Return value will be ZodError with validation message"},"401":{"description":"Unauthorized"},"404":{"description":"Contributors not found","content":{"application/json":{"schema":{"type":"object","properties":{"errors":{"type":"array","items":{"type":"object","properties":{"message":{"type":"string"}},"required":["message"]}}},"required":["errors"]}}}},"500":{"description":"Failed to process request","content":{"application/json":{"schema":{"type":"object","properties":{"errors":{"type":"array","items":{"type":"object","properties":{"message":{"type":"string"}},"required":["message"]}}},"required":["errors"]}}}}}}}}}
```

### List Contributors

## GET contributors/

> List the contributors in a domain

```json
{"openapi":"3.0.0","info":{"title":"Issues API","version":"1.0.0"},"servers":[{"url":"https://logilica.io/api/import/v1/"}],"paths":{"contributors/":{"get":{"description":"List the contributors in a domain","responses":{"200":{"description":"Success","content":{"application/json":{"schema":{"type":"object","properties":{"message":{"type":"string"}},"required":["message"]}}}},"400":{"description":"Data given doesn't match schema. Return value will be ZodError with validation message"},"401":{"description":"Unauthorized"},"404":{"description":"Contributor not found","content":{"application/json":{"schema":{"type":"object","properties":{"errors":{"type":"array","items":{"type":"object","properties":{"message":{"type":"string"}},"required":["message"]}}},"required":["errors"]}}}},"500":{"description":"Failed to process request","content":{"application/json":{"schema":{"type":"object","properties":{"errors":{"type":"array","items":{"type":"object","properties":{"message":{"type":"string"}},"required":["message"]}}},"required":["errors"]}}}}}}}}}
```


# Export API

The Logilica platform enables you to query your data using a semantic data layer.

### Using the API

The following example shows how to use the Export API to fetch the average lead time for tickets within a workspace.

The cURL GET command is below. Note, that the GET command includes the example API token `lgca_UeRxFs_3RYRJEJtdYp7j7Wa6DirG5NjiYslsb` and the example workspace `myworkspace`.

```bash
curl --location  -G 'https://logilica.io/api/query/load' \
    --header 'X-lgca-token: lgca_UeRxFs_3RYRJEJtdYp7j7Wa6DirG5NjiYslsb' \
    --header 'x-lgca-domain: myworkspace' \
    --data-urlencode 'query={
        "measures":["JiraIssueDetail.avgLeadTime"],
        "dimensions":[],
        "filters":[],
        "timeDimensions":[]}'
```

The above query returns the following response.

```json
{
    "query": {
        "measures": [
            "JiraIssueDetail.avgLeadTime"
        ],
        "dimensions": [],
        "filters": [],
        "timeDimensions": [],
        "limit": 10000,
        "timezone": "UTC",
        "rowLimit": 10000
    },
    "data": [
        {
            "JiraIssueDetail.avgLeadTime": 1353.4052033405958
        }
    ],
    "lastRefreshTime": "2024-10-31T04:57:55.297Z"
    // ... additional metadata
}
```

The result of the query is provided in the `data` field of the response. The query that was run is also returned, along with some other metadata including the last time the data was refreshed by the semantic layer.

### Query Format

Queries to the semantic layer are constructed as JSON objects, and have the following fields:

<table><thead><tr><th width="216">Field</th><th width="201">Type</th><th>Description</th></tr></thead><tbody><tr><td><code>dimensions</code></td><td><code>string[]</code></td><td>A list of dimensions as found in the <a href="/advanced/datastudio-data-model">DataStudio Data Model</a></td></tr><tr><td><code>measures</code></td><td><code>string[]</code></td><td>A list of measures as found in the <a href="/advanced/datastudio-data-model">DataStudio Data Model</a></td></tr><tr><td><code>filters</code></td><td><code>Filter[]</code></td><td>A list of <a href="#filters">filter objects</a> to apply to the query</td></tr><tr><td><code>timeDimensions</code></td><td><code>TimeDimensions[]</code></td><td>A list of <a href="#time-dimensions">time dimensions</a> to filter the query on</td></tr><tr><td><code>order</code></td><td><code>object</code></td><td>Key/value pairs of measures/dimensions and direction to sort ("asc" or "desc")</td></tr></tbody></table>

Each of these fields are required, however they may be empty (e.g. an empty list or an object with no keys).

Below is an example query that fetches the number of Resolved ticket events for the team "Example Team" per Jira Issue Type for the month of October 2024. This shows the weekly ticket throughput for the team.

```json
{
    "measures": [
        "JiraIssueEvent.eventCount"
    ],
    "dimensions": [
        "JiraIssueDetail.type"
    ]
    "timeDimensions": [
        {
            "dimension": "JiraIssueEvent.timeInterval",
            "granularity": "week",
            "dateRange": [ "2024-10-01", "2024-10-31" ]
        }
    ],
    "filters": [
        {
            "member": "JiraIssueEvent.event",
            "operator": "equals",
            "values": [
                "Resolved"
            ]
        },
        {
            "member": "JiraIssueDetail.statusCategory",
            "operator": "equals",
            "values": [
                "Done"
            ]
        },
        {
            "member": "Team.name",
            "operator": "equals",
            "values:" [ "Example Team" ]
        }
    ],
    "order": {
        "JiraIssueDetail.type": "asc"
    },

}
```

### Filters

Filters are objects that specify how to filter the data with respect to the dimensions and measures available. They contain the following fields:

<table><thead><tr><th width="216">Field</th><th width="201">Type</th><th>Description</th></tr></thead><tbody><tr><td><code>member</code></td><td><code>string</code></td><td>The dimension or measure to use in the filter, a list of these can be found in the <a href="/advanced/datastudio-data-model">DataStudio Data Model</a></td></tr><tr><td><code>operator</code></td><td><code>filter-operator</code></td><td>The comparison operator to use in the filter. One of <code>equals</code>, <code>notEquals</code>, <code>contains</code>, <code>notContains</code>, <code>startsWith</code>, <code>notStartsWith</code>, <code>endsWith</code>, <code>notEndsWith</code>, <code>gt</code>, <code>gte</code>, <code>lt</code>, <code>lte</code>, <code>set</code>, <code>notSet</code> . <a href="#filter-operators">See below for more information</a>.</td></tr><tr><td><code>values</code></td><td><code>string[]</code></td><td>Array of values for the filter. These must be of type string, with numbers being converted from strings by the semantic layer.</td></tr></tbody></table>

Both the `member` and `operator` field are required, the `value` field is only required for some operators.

#### Filter Operators

* `equals` - matches exactly on the `values` in the array
* `contains` - a case insensitive wild card match on the `values` in the array (similar to `LIKE %`)
* `startsWith` - matches any string that starts with one of the `values` in the values array
* `endsWith` - matches any string that ends with one of the `values` in the values array
* `gt` - matches numeric values greater than the value in the `values` array
* `gte` - matches numeric values greater than or equal to the value in the `values` array
* `lt` - matches numeric values less than the value in the `values` array
* `lte` - matches numeric values less than or equal to the value in the `values` array
* `set` - checks if the value is not null. This operator does not use the `values` array

A number of filter operators have a `not` equivalent (e.g. `notEquals`). These are the negations of the relevant operator. The `not` operators available are: `notEquals`, `notContains`, `notStartsWith`, `notEndsWith` and `notSet`.

### Time Dimensions

Time dimensions are filters specifically on time intervals. These allow you to specify the time interval you wish to fetch in your dataset.

<table><thead><tr><th width="216">Field</th><th width="201">Type</th><th>Description</th></tr></thead><tbody><tr><td><code>dimension</code></td><td><code>string</code></td><td>The time dimension to use. These can be found in the <a href="/advanced/datastudio-data-model">DataStudio Data Model</a> and typically have the name <code>timeInterval</code></td></tr><tr><td><code>dateRange</code></td><td><code>string[]</code></td><td>An array of two date strings, the first being the start time and the second being the end. For example, <code>[ "2024-10-01", "2024-10-31" ]</code></td></tr><tr><td><code>granularity</code></td><td><code>string</code></td><td>The granularity to group the data by. Can be <code>days</code>, <code>weeks</code>, <code>months</code>, <code>years</code></td></tr></tbody></table>

Both `dimension` and `dateRange` are required fields. Omitting `granularity` is permitted and will mean that your data is ungrouped by time.


# DataStudio

At the core of Logilica's charting and data querying is our embedded analytics, DataStudio. Enterprise users get full access to this facility.

The DataStudio comes with rich query capabilities and its own UI. The DataStudio is built on a data model designed for powerful use cases and tuned for high efficiency.

## Sorting Query Results

When building a query, you can add one or more sorts on any of the selected dimensions, measures or time fields, choosing ascending or descending order for each. Multiple sorts are applied in the order they are added. Sorting is saved as part of the query when you save the resulting chart.

The following documentation pages describes the features of the DataStudio and the data model and its fields in more detail.

<figure><img src="https://3637178088-files.gitbook.io/~/files/v0/b/gitbook-x-prod.appspot.com/o/spaces%2FvMP8keAdyp2axoLILtL5%2Fuploads%2Fgit-blob-fbaeb38e33efea1d861a2fc283d8ec0cf5c8b2c4%2Fdatalab.png?alt=media" alt="" width="563"><figcaption><p>Logilica's DataStudio for rich queries and chart generation</p></figcaption></figure>

For additional questions or training, contact the support team at <support@logilica.com>. We are also here to help you build new dashboards, charts and metrics. Contact us for additional use cases you would like to see covered.


# Data Models

The data models Logilica exposes are described in the following pages.

The key data concepts are centred around **Cubes.** Cubes represent data silos such as issues, PRs, and build actions. In cubes, you define all the calculations within the measures and dimensions of these entities. Additionally, we define relationships between cubes, such as "an issue has associated PRs" or "each PR has a work type".


# AI Usage

## Description

Usage data from AI Services.

## Measures

| Name                                       | Title                       | Description                                                                                                                                                             |
| ------------------------------------------ | --------------------------- | ----------------------------------------------------------------------------------------------------------------------------------------------------------------------- |
| `AiUsage.totalDaysUsed`                    | Total Days Used             | Number of days with recorded AI service usage. Each entry represents a single day where the service's AI was used, e.g. chat requests and file modifications.           |
| `AiUsage.totalNumberOfLinesAddedByAi`      | Total Lines Added by AI     | Total number of lines added by AI.                                                                                                                                      |
| `AiUsage.totalNumberOfLinesDeletedByAi`    | Total Lines Deleted by AI   | Total number of lines deleted by AI.                                                                                                                                    |
| `AiUsage.totalNumberOfLinesEditedByAi`     | Total Lines Edited by AI    | Total number of lines edited by AI.                                                                                                                                     |
| `AiUsage.totalSpendings`                   | Total Cents Spent           | Total cents spending.                                                                                                                                                   |
| `AiUsage.avgNumberOfLinesAddedByAi`        | Avg Lines Added by AI       | Average number of lines added by AI.                                                                                                                                    |
| `AiUsage.avgNumberOfLinesDeletedByAi`      | Avg Lines Deleted by AI     | Average number of lines deleted by AI.                                                                                                                                  |
| `AiUsage.avgNumberOfLinesEditedByAi`       | Avg Lines Edited by AI      | Average number of lines edited by AI.                                                                                                                                   |
| `AiUsage.avgNumberOfInteractions`          | Avg Number of Interactions  | Average number of interactions with AI. Interactions are the individual instances where the user uses the service's AI, e.g. chat requests and file modifications.      |
| `AiUsage.minNumberOfLinesAddedByAi`        | Min Lines Added by AI       | The smallest number of lines added by AI.                                                                                                                               |
| `AiUsage.minNumberOfLinesDeletedByAi`      | Min Lines Deleted by AI     | The smallest number of lines deleted by AI.                                                                                                                             |
| `AiUsage.minNumberOfLinesEditedByAi`       | Min Lines Edited by AI      | The smallest number of lines edited by AI.                                                                                                                              |
| `AiUsage.minNumberOfInteractions`          | Min Number of Interactions  | The smallest number of interactions with AI. Interactions are the individual instances where the user uses the service's AI, e.g. chat requests and file modifications. |
| `AiUsage.maxNumberOfLinesAddedByAi`        | Max Lines Added by AI       | The largest number of lines added by AI.                                                                                                                                |
| `AiUsage.maxNumberOfLinesDeletedByAi`      | Max Lines Deleted by AI     | The largest number of lines deleted by AI.                                                                                                                              |
| `AiUsage.maxNumberOfLinesEditedByAi`       | Max Lines Edited by AI      | The largest number of lines edited by AI.                                                                                                                               |
| `AiUsage.maxNumberOfInteractions`          | Max Number of Interactions  | The largest number of interactions with AI. Interactions are the individual instances where the user uses the service's AI, e.g. chat requests and file modifications.  |
| `AiUsage.avgCentsSpent`                    | Avg Cents Spent             | The average cents spent.                                                                                                                                                |
| `AiUsage.minCentsSpent`                    | Min Cents Spent             | The least cents spent.                                                                                                                                                  |
| `AiUsage.maxCentsSpent`                    | Max Cents Spent             | The most cents spent.                                                                                                                                                   |
| `AiUsage.avgNumberOfModifiedFiles`         | Avg Files Modified          | The average number of files modified by AI.                                                                                                                             |
| `AiUsage.minNumberOfModifiedFiles`         | Min Files Modified          | The smallest number of files modified by AI.                                                                                                                            |
| `AiUsage.maxNumberOfModifiedFiles`         | Max Files Modified          | The largest number of files modified by AI.                                                                                                                             |
| `AiUsage.totalNumberOfFilesModified`       | Total Files Modified        | The total number of files modified.                                                                                                                                     |
| `AiUsage.avgNumberOfAcceptedAiSuggestions` | Avg Accepted AI Suggestions | Average number of accepted AI suggestions.                                                                                                                              |
| `AiUsage.minNumberOfAcceptedAiSuggestions` | Min Accepted AI Suggestions | The smallest number of accepted AI suggestions.                                                                                                                         |
| `AiUsage.maxNumberOfAcceptedAiSuggestions` | Max Accepted AI Suggestions | The largest number of accepted AI suggestions.                                                                                                                          |
| `AiUsage.avgNumberOfRejectedAiSuggestions` | Avg Rejected AI Suggestions | Average number of rejected AI suggestions.                                                                                                                              |
| `AiUsage.minNumberOfRejectedAiSuggestions` | Min Rejected AI Suggestions | The smallest number of rejected AI suggestions.                                                                                                                         |
| `AiUsage.maxNumberOfRejectedAiSuggestions` | Max Rejected AI Suggestions | The largest number of rejected AI suggestions.                                                                                                                          |
| `AiUsage.avgTotalNumberOfAiSuggestions`    | Avg Total AI Suggestions    | Average total number of suggestions made by AI.                                                                                                                         |
| `AiUsage.minTotalNumberOfAiSuggestions`    | Min Total AI Suggestions    | The smallest total number of suggestions made by AI.                                                                                                                    |
| `AiUsage.maxTotalNumberOfAiSuggestions`    | Max Total AI Suggestions    | The largest total number of suggestions made by AI.                                                                                                                     |

## Dimensions

| Name                                    | Title                             | Description                                                                                                                                  |
| --------------------------------------- | --------------------------------- | -------------------------------------------------------------------------------------------------------------------------------------------- |
| `AiUsage.id`                            | Id                                |                                                                                                                                              |
| `AiUsage.timeInterval`                  | Time                              | The day of this AI Usage.                                                                                                                    |
| `AiUsage.linesAddedByAi`                | Lines Added by AI                 | Total number of lines added by AI.                                                                                                           |
| `AiUsage.linesDeletedByAi`              | Lines Deleted by AI               | Total number of lines deleted by AI.                                                                                                         |
| `AiUsage.linesEditedByAi`               | Total Lines Edited by AI          | Number of lines edited by AI.                                                                                                                |
| `AiUsage.numberOfAcceptedAiSuggestions` | Number of Accepted AI Suggestions | Number of accepted AI suggestions (e.g. code blocks, tab completion).                                                                        |
| `AiUsage.numberOfRejectedAiSuggestions` | Number of Rejected AI Suggestions | Number of rejected AI suggestions (e.g. code blocks, tab completion).                                                                        |
| `AiUsage.totalNumberOfAiSuggestions`    | Total Number of AI Suggestions    | Number of suggestions made by AI (e.g. code blocks, tab completion).                                                                         |
| `AiUsage.numberOfInteractions`          | Number of Interactions            | The number of interactions the user did. Interactions are the individual instances where the user uses the service's AI, e.g. chat requests. |
| `AiUsage.centsSpent`                    | Cents Spent                       | Total cents spent on this entry.                                                                                                             |
| `AiUsage.numberOfModifiedFiles`         | Number of Files Modified          | The number of files modified in this entry.                                                                                                  |
| `AiUsage.modelUsed`                     | LLM Model Used                    | The LLM model used for this usage entry.                                                                                                     |
| `AiUsage.service`                       | AI Service Tool                   | The AI service tool used for this usage entry, e.g. Cursor, Claude Code or GitHub Copilot.                                                   |

## Connected Cubes

All fields belonging to the following cubes are also reachable from AiUsage:

* [Contributor](/advanced/datastudio-data-model/models/contributor)
* [AI Usage File](/advanced/datastudio-data-model/models/aiusagefile)
* [AI Usage Interactions](/advanced/datastudio-data-model/models/aiusageinteractions)


# AI Commits

## Description

Commits assisted by AI.

## Measures

| Name                                      | Title                     | Description                                 |
| ----------------------------------------- | ------------------------- | ------------------------------------------- |
| `AiCommits.count`                         | Count                     | Total number of commits assisted by AI.     |
| `AiCommits.totalNumberOfLinesAddedByAi`   | Total Lines Added by AI   | Total number of lines added by AI.          |
| `AiCommits.totalNumberOfLinesDeletedByAi` | Total Lines Deleted by AI | Total number of lines deleted by AI.        |
| `AiCommits.totalNumberOfLinesEditedByAi`  | Total Lines Edited by AI  | Total number of lines edited by AI.         |
| `AiCommits.avgNumberOfLinesAddedByAi`     | Avg Lines Added by AI     | Average number of lines added by AI.        |
| `AiCommits.avgNumberOfLinesDeletedByAi`   | Avg Lines Deleted by AI   | Average number of lines deleted by AI.      |
| `AiCommits.avgNumberOfLinesEditedByAi`    | Avg Lines Edited by AI    | Average number of lines edited by AI.       |
| `AiCommits.minNumberOfLinesAddedByAi`     | Min Lines Added by AI     | The smallest number of lines added by AI.   |
| `AiCommits.minNumberOfLinesDeletedByAi`   | Min Lines Deleted by AI   | The smallest number of lines deleted by AI. |
| `AiCommits.minNumberOfLinesEditedByAi`    | Min Lines Edited by AI    | The smallest number of lines edited by AI.  |
| `AiCommits.maxNumberOfLinesAddedByAi`     | Max Lines Added by AI     | The largest number of lines added by AI.    |
| `AiCommits.maxNumberOfLinesDeletedByAi`   | Max Lines Deleted by AI   | The largest number of lines deleted by AI.  |
| `AiCommits.maxNumberOfLinesEditedByAi`    | Max Lines Edited by AI    | The largest number of lines edited by AI.   |

## Dimensions

| Name                             | Title                    | Description                                                                                |
| -------------------------------- | ------------------------ | ------------------------------------------------------------------------------------------ |
| `AiCommits.id`                   | Id                       |                                                                                            |
| `AiCommits.commitHash`           | Commit Hash              | The hash of the commit assisted by AI.                                                     |
| `AiCommits.repositoryName`       | Repository Name          | The repository the commit belongs to.                                                      |
| `AiCommits.branchName`           | Branch Name              | The branch the commit was made on.                                                         |
| `AiCommits.linesAddedByAi`       | Lines Added by AI        | Lines added by AI.                                                                         |
| `AiCommits.linesDeletedByAi`     | Lines Deleted by AI      | Lines deleted by AI.                                                                       |
| `AiCommits.totalLinesEditedByAi` | Total Lines Edited by AI | Total lines edited by AI.                                                                  |
| `AiCommits.service`              | AI Service Tool          | The AI service tool used for this usage entry, e.g. Cursor, Claude Code or GitHub Copilot. |

## Connected Cubes

All fields belonging to the following cubes are also reachable from AiCommits:

* [Contributor](/advanced/datastudio-data-model/models/contributor)
* [Repositories](/advanced/datastudio-data-model/models/project)


# AI Usage File

## Description

Files that were modified by AI, relating back to an AI Usage record.

## Measures

| Name                                      | Title                   | Description                                 |
| ----------------------------------------- | ----------------------- | ------------------------------------------- |
| `AiUsageFile.count`                       | Count                   | Total number of files.                      |
| `AiUsageFile.avgNumberOfLinesAddedByAi`   | Avg Lines Added by AI   | Average number of lines added by AI.        |
| `AiUsageFile.avgNumberOfLinesDeletedByAi` | Avg Lines Deleted by AI | Average number of lines deleted by AI.      |
| `AiUsageFile.avgNumberOfLinesEditedByAi`  | Avg Lines Edited by AI  | Average number of lines edited by AI.       |
| `AiUsageFile.minNumberOfLinesAddedByAi`   | Min Lines Added by AI   | The smallest number of lines added by AI.   |
| `AiUsageFile.minNumberOfLinesDeletedByAi` | Min Lines Deleted by AI | The smallest number of lines deleted by AI. |
| `AiUsageFile.minNumberOfLinesEditedByAi`  | Min Lines Edited by AI  | The smallest number of lines edited by AI.  |
| `AiUsageFile.maxNumberOfLinesAddedByAi`   | Max Lines Added by AI   | The largest number of lines added by AI.    |
| `AiUsageFile.maxNumberOfLinesDeletedByAi` | Max Lines Deleted by AI | The largest number of lines deleted by AI.  |
| `AiUsageFile.maxNumberOfLinesEditedByAi`  | Max Lines Edited by AI  | The largest number of lines edited by AI.   |

## Dimensions

| Name                                   | Title                    | Description                    |
| -------------------------------------- | ------------------------ | ------------------------------ |
| `AiUsageFile.id`                       | Id                       |                                |
| `AiUsageFile.path`                     | File Path                | The file assisted by AI.       |
| `AiUsageFile.numberOfLinesAddedByAi`   | Lines Added by AI        | Number of lines added by AI.   |
| `AiUsageFile.numberOfLinesDeletedByAi` | Lines Deleted by AI      | Number of lines deleted by AI. |
| `AiUsageFile.totalLinesEditedByAi`     | Total Lines Edited by AI | Number of lines edited by AI.  |

## Connected Cubes

All fields belonging to the following cubes are also reachable from AiUsageFile:

* [AI Usage](/advanced/datastudio-data-model/models/aiusage)


# AI Usage Interactions

## Description

Different types of interactions with an AI tool, relating back to an AI Usage record.

## Measures

| Name                                          | Title                      | Description                                  |
| --------------------------------------------- | -------------------------- | -------------------------------------------- |
| `AiUsageInteractions.count`                   | Count                      | Number of interactions.                      |
| `AiUsageInteractions.totalInteractionsWithAi` | Total Interactions with AI | Total number of interactions with AI.        |
| `AiUsageInteractions.avgInteractionsWithAi`   | Avg Interactions with AI   | Average number of interactions with AI.      |
| `AiUsageInteractions.minInteractionsWithAi`   | Min Interactions with AI   | The smallest number of interactions with AI. |
| `AiUsageInteractions.maxInteractionsWithAi`   | Max Interactions with AI   | The largest number of interactions with AI.  |

## Dimensions

| Name                            | Title             | Description                                                               |
| ------------------------------- | ----------------- | ------------------------------------------------------------------------- |
| `AiUsageInteractions.id`        | Id                |                                                                           |
| `AiUsageInteractions.type`      | Interaction Type  | The type of AI interaction, e.g. chat, composer, agent or tab completion. |
| `AiUsageInteractions.typeCount` | Interaction Count | The number of times an interaction type occurred.                         |

## Connected Cubes

All fields belonging to the following cubes are also reachable from AiUsageInteractions:

* [AI Usage](/advanced/datastudio-data-model/models/aiusage)


# CI Build

## Description

Metrics relating to individual build runs as imported from a CI Build tool (e.g. GitHub Actions, CircleCI).

## Measures

| Name                         | Title                | Description                                                         |
| ---------------------------- | -------------------- | ------------------------------------------------------------------- |
| `CiBuild.totalDuration`      | Total Duration       | The total duration time across build runs, in seconds.              |
| `CiBuild.avgDuration`        | Avg Duration         | The average duration across build runs, in seconds.                 |
| `CiBuild.medianDuration`     | Median Duration      | The median duration across build runs, in seconds.                  |
| `CiBuild.p90Duration`        | P90 Duration         | The 90th percentile of duration values, in seconds.                 |
| `CiBuild.minStartedAt`       | Min Started at       | The earliest UNIX timestamp that a CI build started.                |
| `CiBuild.count`              | Count                | A count of CI build records.                                        |
| `CiBuild.totalRecoveryTime`  | Total Recovery Time  | Total recovery time across CI builds, in seconds.                   |
| `CiBuild.avgRecoveryTime`    | Avg Recovery Time    | Average recovery time across CI builds, in seconds.                 |
| `CiBuild.medianRecoveryTime` | Median Recovery Time | Median recovery time across CI builds, in seconds.                  |
| `CiBuild.p90RecoveryTime`    | P90 Recovery Time    | The 90th percentile of recovery times across CI builds, in seconds. |

## Dimensions

| Name                   | Title         | Description                                                             |
| ---------------------- | ------------- | ----------------------------------------------------------------------- |
| `CiBuild.timeInterval` | Created Time  | The timestamp of when the CI Build was started.                         |
| `CiBuild.id`           | Id            |                                                                         |
| `CiBuild.key`          | Key           | Key or external reference for this CI build.                            |
| `CiBuild.origin`       | Origin        | The source system this CI build comes from, e.g., 'GitHub' or 'GitLab'. |
| `CiBuild.name`         | Name          | Name of this CI build.                                                  |
| `CiBuild.status`       | Status        | Status of this CI build, e.g., 'Running' or 'Completed'.                |
| `CiBuild.conclusion`   | Conclusion    | The result of this CI build, e.g., 'Success' or 'Failed'.               |
| `CiBuild.duration`     | Duration      | The time the CI build took to run, in seconds.                          |
| `CiBuild.startedAt`    | Started at    | UNIX timestamp of when this CI build started.                           |
| `CiBuild.recoveryTime` | Recovery Time | Time taken for this CI build to recover after a failure, in seconds.    |

## Connected Cubes

All fields belonging to the following cubes are also reachable from CiBuild:

* [CI Build](/advanced/datastudio-data-model/models/cibuild)
* [CI Build Stage](/advanced/datastudio-data-model/models/cibuildstage)
* [Contributor](/advanced/datastudio-data-model/models/contributor)
* [Team](/advanced/datastudio-data-model/models/team)
* [Pull Request](/advanced/datastudio-data-model/models/pullrequestdetail)
* [Pull Request Jira Issue](/advanced/datastudio-data-model/models/pullrequestjiraissue)
* [Pull Request Event](/advanced/datastudio-data-model/models/pullrequestevent)
* [Repositories](/advanced/datastudio-data-model/models/project)


# CI Build Stage

## Description

Metrics relating to an individual state in a broader CI pipeline, e.g. a testing or linting phase as part of a large build pipeline.

## Measures

| Name                          | Title           | Description                                                   |
| ----------------------------- | --------------- | ------------------------------------------------------------- |
| `CiBuildStage.totalDuration`  | Total Duration  | Total duration time across CI build stages, in seconds.       |
| `CiBuildStage.avgDuration`    | Avg Duration    | Average duration time across CI build stages, in seconds.     |
| `CiBuildStage.medianDuration` | Median Duration | Median duration time across CI build stages, in seconds.      |
| `CiBuildStage.p90Duration`    | P90 Duration    | The 90th percentile duration for CI build stages, in seconds. |
| `CiBuildStage.minStartedAt`   | Min Started at  | The earliest UNIX timestamp for when a stage started.         |
| `CiBuildStage.count`          | Count           | Count of CI build stages.                                     |

## Dimensions

| Name                      | Title      | Description                                                   |
| ------------------------- | ---------- | ------------------------------------------------------------- |
| `CiBuildStage.id`         | Id         |                                                               |
| `CiBuildStage.name`       | Name       | Name of the CI build stage.                                   |
| `CiBuildStage.status`     | Status     | Status of the build stage, e.g., 'Running' or 'Completed'.    |
| `CiBuildStage.conclusion` | Conclusion | Final outcome of the build stage, e.g., 'Success', 'Failure'. |
| `CiBuildStage.duration`   | Duration   | Time taken to run this CI build stage, in seconds.            |
| `CiBuildStage.startedAt`  | Started at | UNIX timestamp of when this CI build stage started.           |

## Connected Cubes

All fields belonging to the following cubes are also reachable from CiBuildStage:

* [CI Build](/advanced/datastudio-data-model/models/cibuild)
* [CI Build Stage](/advanced/datastudio-data-model/models/cibuildstage)
* [Contributor](/advanced/datastudio-data-model/models/contributor)
* [Team](/advanced/datastudio-data-model/models/team)
* [Repositories](/advanced/datastudio-data-model/models/project)


# Contributor

## Description

A listing of individuals who has contributed to an imported project, taken from third-party accounts (e.g. GitHub, Jira and others).

## Measures

| Name                | Title | Description                        |
| ------------------- | ----- | ---------------------------------- |
| `Contributor.count` | Count | The number of unique contributors. |

## Dimensions

| Name                | Title | Description                            |
| ------------------- | ----- | -------------------------------------- |
| `Contributor.name`  | Name  | The full name of the contributor.      |
| `Contributor.key`   | Key   | Unique identifier for the contributor. |
| `Contributor.email` | Email | Email address of the contributor.      |
| `Contributor.id`    | Id    |                                        |

## Connected Cubes

All fields belonging to the following cubes are also reachable from Contributor:

* [Team](/advanced/datastudio-data-model/models/team)
* [Pull Request](/advanced/datastudio-data-model/models/pullrequestdetail)
* [Pull Request Jira Issue](/advanced/datastudio-data-model/models/pullrequestjiraissue)
* [Pull Request Event](/advanced/datastudio-data-model/models/pullrequestevent)
* [Planning Ticket Component](/advanced/datastudio-data-model/models/jiracomponent)
* [Planning Ticket Custom Field](/advanced/datastudio-data-model/models/jiracustomfield)
* [Epic](/advanced/datastudio-data-model/models/jiraepic)
* [Planning Ticket Hierarchy Issues](/advanced/datastudio-data-model/models/jirahierarchyissues)
* [Planning Ticket Hierarchy Issue Link](/advanced/datastudio-data-model/models/jiraissuehierarchylink)
* [Planning Ticket](/advanced/datastudio-data-model/models/jiraissuedetail)
* [Planning Ticket Event](/advanced/datastudio-data-model/models/jiraissueevent)
* [Planning Ticket Label](/advanced/datastudio-data-model/models/jiralabel)
* [Planning Sprint](/advanced/datastudio-data-model/models/jirasprint)
* [Planning Ticket State Durations](/advanced/datastudio-data-model/models/jirastatedurations)
* [CI Build](/advanced/datastudio-data-model/models/cibuild)
* [CI Build Stage](/advanced/datastudio-data-model/models/cibuildstage)
* [Contributor](/advanced/datastudio-data-model/models/contributor)
* [Repositories](/advanced/datastudio-data-model/models/project)
* [Coverage Commit](/advanced/datastudio-data-model/models/coveragecommit)
* [Coverage Custom Fields](/advanced/datastudio-data-model/models/coveragecustomfield)
* [Coverage File](/advanced/datastudio-data-model/models/coveragefile)
* [Coverage Labels](/advanced/datastudio-data-model/models/coveragelabel)
* [Coverage Test Result](/advanced/datastudio-data-model/models/coveragetestresult)


# Coverage Commit

## Description

Metrics relating to testing coverage by commit.

## Measures

| Name                                 | Title                   | Description                                     |
| ------------------------------------ | ----------------------- | ----------------------------------------------- |
| `CoverageCommit.count`               | Count                   | The number of the coverage commits.             |
| `CoverageCommit.minTotalLinesOfCode` | Min Total Lines of Code | Smallest amount of total lines of code covered. |
| `CoverageCommit.maxTotalLinesOfCode` | Max Total Lines of Code | Largest amount of total lines of code covered.  |
| `CoverageCommit.avgTotalLinesOfCode` | Avg Total Lines of Code | Average lines of code covered.                  |
| `CoverageCommit.minHits`             | Min Hits                | Minimum number of fully covered lines.          |
| `CoverageCommit.maxHits`             | Max Hits                | Maximum number of fully covered lines.          |
| `CoverageCommit.avgHits`             | Avg Hits                | Average number of fully covered lines.          |
| `CoverageCommit.minPartials`         | Min Partials            | Minimum number of partially covered lines.      |
| `CoverageCommit.maxPartials`         | Max Partials            | Maximum number of partially covered lines.      |
| `CoverageCommit.avgPartials`         | Avg Partials            | Average number of partially covered lines.      |
| `CoverageCommit.minMiss`             | Min Miss                | Minimum number of uncovered lines.              |
| `CoverageCommit.maxMiss`             | Max Miss                | Maximum number of uncovered lines.              |
| `CoverageCommit.avgMiss`             | Avg Miss                | Average number of uncovered lines.              |
| `CoverageCommit.minCoveragePercent`  | Min Coverage Percent    | Minimum coverage percentage.                    |
| `CoverageCommit.maxCoveragePercent`  | Max Coverage Percent    | Maximum coverage percentage.                    |
| `CoverageCommit.avgCoveragePercent`  | Avg Coverage Percent    | Average coverage percentage.                    |

## Dimensions

| Name                              | Title               | Description                                                         |
| --------------------------------- | ------------------- | ------------------------------------------------------------------- |
| `CoverageCommit.id`               | Id                  | Unique identifier for this coverage commit.                         |
| `CoverageCommit.commitHash`       | Commit Hash         | Git commit hash associated with this coverage data.                 |
| `CoverageCommit.branch`           | Branch              | Git branch where this coverage commit was made.                     |
| `CoverageCommit.state`            | State               | Status of the coverage commit (e.g., complete, pending).            |
| `CoverageCommit.passedCI`         | Passed Ci           | Indicates whether this coverage commit passed CI.                   |
| `CoverageCommit.totalLinesOfCode` | Total Lines of Code | Total number of lines of code in this coverage commit.              |
| `CoverageCommit.hits`             | Hits                | Number of lines fully covered by tests in this coverage commit.     |
| `CoverageCommit.partials`         | Partials            | Number of lines partially covered by tests in this coverage commit. |
| `CoverageCommit.miss`             | Miss                | Number of lines missed by tests in this coverage commit.            |
| `CoverageCommit.coveragePercent`  | Coverage Percent    | Percentage of code covered by tests in this coverage commit.        |
| `CoverageCommit.timeInterval`     | Commit Timestamp    | Timestamp of when this coverage commit was made.                    |

## Connected Cubes

All fields belonging to the following cubes are also reachable from CoverageCommit:

* [Contributor](/advanced/datastudio-data-model/models/contributor)
* [Team](/advanced/datastudio-data-model/models/team)
* [Coverage Commit](/advanced/datastudio-data-model/models/coveragecommit)
* [Coverage Custom Fields](/advanced/datastudio-data-model/models/coveragecustomfield)
* [Coverage File](/advanced/datastudio-data-model/models/coveragefile)
* [Coverage Labels](/advanced/datastudio-data-model/models/coveragelabel)
* [Coverage Test Result](/advanced/datastudio-data-model/models/coveragetestresult)


# Coverage Custom Fields

## Description

Values from custom fields related to test results.

## Measures

| Name                        | Title | Description                                           |
| --------------------------- | ----- | ----------------------------------------------------- |
| `CoverageCustomField.count` | Count | A count of the custom fields for test coverage files. |

## Dimensions

| Name                        | Title | Description                               |
| --------------------------- | ----- | ----------------------------------------- |
| `CoverageCustomField.id`    | Id    |                                           |
| `CoverageCustomField.name`  | Name  | The name of the custom field as imported. |
| `CoverageCustomField.value` | Value | The value assigned to the custom field.   |

## Connected Cubes

All fields belonging to the following cubes are also reachable from CoverageCustomField:

* [Coverage Commit](/advanced/datastudio-data-model/models/coveragecommit)
* [Coverage Custom Fields](/advanced/datastudio-data-model/models/coveragecustomfield)
* [Coverage File](/advanced/datastudio-data-model/models/coveragefile)
* [Coverage Labels](/advanced/datastudio-data-model/models/coveragelabel)
* [Coverage Test Result](/advanced/datastudio-data-model/models/coveragetestresult)
* [Contributor](/advanced/datastudio-data-model/models/contributor)
* [Team](/advanced/datastudio-data-model/models/team)
* [Repositories](/advanced/datastudio-data-model/models/project)


# Coverage File

## Description

Metrics relating to test coverage by file.

## Measures

| Name                               | Title                   | Description                                |
| ---------------------------------- | ----------------------- | ------------------------------------------ |
| `CoverageFile.count`               | Count                   | Counts the coverage file entries.          |
| `CoverageFile.minTotalLinesOfCode` | Min Total Lines of Code | Smallest total lines of code covered.      |
| `CoverageFile.maxTotalLinesOfCode` | Max Total Lines of Code | Largest total line of code covered.        |
| `CoverageFile.avgTotalLinesOfCode` | Avg Total Lines of Code | Average lines of code covered.             |
| `CoverageFile.minHits`             | Min Hits                | Minimum number of fully covered lines.     |
| `CoverageFile.maxHits`             | Max Hits                | Maximum number of fully covered lines.     |
| `CoverageFile.avgHits`             | Avg Hits                | Average number of fully covered lines.     |
| `CoverageFile.minPartials`         | Min Partials            | Minimum number of partially covered lines. |
| `CoverageFile.maxPartials`         | Max Partials            | Maximum number of partially covered lines. |
| `CoverageFile.avgPartials`         | Avg Partials            | Average number of partially covered lines. |
| `CoverageFile.minMiss`             | Min Miss                | Minimum number of uncovered lines.         |
| `CoverageFile.maxMiss`             | Max Miss                | Maximum number of uncovered lines.         |
| `CoverageFile.avgMiss`             | Avg Miss                | Average number of uncovered lines.         |
| `CoverageFile.minCoveragePercent`  | Min Coverage Percent    | Minimum coverage percentage.               |
| `CoverageFile.maxCoveragePercent`  | Max Coverage Percent    | Maximum coverage percentage.               |
| `CoverageFile.avgCoveragePercent`  | Avg Coverage Percent    | Average coverage percentage.               |

## Dimensions

| Name                            | Title               | Description                                                |
| ------------------------------- | ------------------- | ---------------------------------------------------------- |
| `CoverageFile.id`               | Id                  |                                                            |
| `CoverageFile.commitHash`       | Commit Hash         | The commit hash corresponding to the coverage file.        |
| `CoverageFile.path`             | Path                | The file path of the coverage file.                        |
| `CoverageFile.totalLinesOfCode` | Total Lines of Code | Total number of lines of code in the file.                 |
| `CoverageFile.hits`             | Hits                | Number of lines of code that were covered by tests.        |
| `CoverageFile.partials`         | Partials            | Number of lines that were only partially covered by tests. |
| `CoverageFile.miss`             | Miss                | Number of lines of code that were not covered by tests.    |
| `CoverageFile.coveragePercent`  | Coverage Percent    | Percentage of lines covered by tests in the file.          |

## Connected Cubes

All fields belonging to the following cubes are also reachable from CoverageFile:

* [Contributor](/advanced/datastudio-data-model/models/contributor)
* [Team](/advanced/datastudio-data-model/models/team)
* [Coverage Commit](/advanced/datastudio-data-model/models/coveragecommit)
* [Coverage Custom Fields](/advanced/datastudio-data-model/models/coveragecustomfield)
* [Coverage File](/advanced/datastudio-data-model/models/coveragefile)
* [Coverage Labels](/advanced/datastudio-data-model/models/coveragelabel)
* [Coverage Test Result](/advanced/datastudio-data-model/models/coveragetestresult)


# Coverage Labels

## Description

Labels associated with test results.

## Measures

| Name                  | Title | Description                        |
| --------------------- | ----- | ---------------------------------- |
| `CoverageLabel.count` | Count | Counts the coverage label entries. |

## Dimensions

| Name                 | Title | Description                     |
| -------------------- | ----- | ------------------------------- |
| `CoverageLabel.id`   | Id    |                                 |
| `CoverageLabel.name` | Name  | The name of the coverage label. |

## Connected Cubes

All fields belonging to the following cubes are also reachable from CoverageLabel:

* [Coverage Commit](/advanced/datastudio-data-model/models/coveragecommit)
* [Coverage Custom Fields](/advanced/datastudio-data-model/models/coveragecustomfield)
* [Coverage File](/advanced/datastudio-data-model/models/coveragefile)
* [Coverage Labels](/advanced/datastudio-data-model/models/coveragelabel)
* [Coverage Test Result](/advanced/datastudio-data-model/models/coveragetestresult)


# Coverage Test Result

## Description

Metrics relating to the running and the results of test runs.

## Measures

| Name                                   | Title                | Description                                   |
| -------------------------------------- | -------------------- | --------------------------------------------- |
| `CoverageTestResult.count`             | Count                | Total number of coverage test result entries. |
| `CoverageTestResult.minDuration`       | Min Duration         | Minimum duration of the test results.         |
| `CoverageTestResult.maxDuration`       | Max Duration         | Maximum duration of the test results.         |
| `CoverageTestResult.avgDuration`       | Avg Duration         | Average duration of the test results.         |
| `CoverageTestResult.totalNumberOfPass` | Total Number of Pass | Total number of tests passing.                |
| `CoverageTestResult.totalNumberOfFail` | Total Number of Fail | Total number of tests failing.                |
| `CoverageTestResult.totalPassPercent`  | Total Pass Percent   | Percentage of passing tests.                  |
| `CoverageTestResult.totalFailPercent`  | Total Fail Percent   | Percentage of failing tests.                  |

## Dimensions

| Name                                 | Title            | Description                                         |
| ------------------------------------ | ---------------- | --------------------------------------------------- |
| `CoverageTestResult.id`              | Id               |                                                     |
| `CoverageTestResult.testResultId`    | Test Result Id   | Unique identifier for the test result.              |
| `CoverageTestResult.testId`          | Test Id          | Test identifier linked with the result.             |
| `CoverageTestResult.commitHash`      | Commit Hash      | The commit hash for the test result.                |
| `CoverageTestResult.branch`          | Branch           | The branch associated with the test result.         |
| `CoverageTestResult.name`            | Name             | Name of the test result.                            |
| `CoverageTestResult.outcome`         | Outcome          | The outcome of the test result.                     |
| `CoverageTestResult.outcomeCategory` | Outcome Category | Category of the test outcome (e.g., Pass, Failure). |
| `CoverageTestResult.duration`        | Duration         | Duration of the test execution.                     |
| `CoverageTestResult.automated`       | Automated        | Indicates whether the test result was automated.    |
| `CoverageTestResult.timeInterval`    | Time of Test Run | Timestamp of when the test result was recorded.     |
| `CoverageTestResult.pullRequest`     | Pull Request     | Pull request identifier related to the test result. |

## Connected Cubes

All fields belonging to the following cubes are also reachable from CoverageTestResult:

* [Contributor](/advanced/datastudio-data-model/models/contributor)
* [Team](/advanced/datastudio-data-model/models/team)
* [Coverage Commit](/advanced/datastudio-data-model/models/coveragecommit)
* [Coverage Custom Fields](/advanced/datastudio-data-model/models/coveragecustomfield)
* [Coverage File](/advanced/datastudio-data-model/models/coveragefile)
* [Coverage Labels](/advanced/datastudio-data-model/models/coveragelabel)
* [Coverage Test Result](/advanced/datastudio-data-model/models/coveragetestresult)


# Planning Ticket Component

## Description

Values of components, as defined in a planning tool, and their relationship to Tickets.

## Measures

| Name                  | Title | Description                                |
| --------------------- | ----- | ------------------------------------------ |
| `JiraComponent.count` | Count | A count of the planning Ticket components. |

## Dimensions

| Name                 | Title | Description            |
| -------------------- | ----- | ---------------------- |
| `JiraComponent.id`   | Id    |                        |
| `JiraComponent.name` | Name  | Name of the component. |

## Connected Cubes

All fields belonging to the following cubes are also reachable from JiraComponent:

* [Planning Ticket Component](/advanced/datastudio-data-model/models/jiracomponent)
* [Planning Ticket Custom Field](/advanced/datastudio-data-model/models/jiracustomfield)
* [Epic](/advanced/datastudio-data-model/models/jiraepic)
* [Planning Ticket Hierarchy Issues](/advanced/datastudio-data-model/models/jirahierarchyissues)
* [Planning Ticket Hierarchy Issue Link](/advanced/datastudio-data-model/models/jiraissuehierarchylink)
* [Planning Ticket](/advanced/datastudio-data-model/models/jiraissuedetail)
* [Planning Ticket Event](/advanced/datastudio-data-model/models/jiraissueevent)
* [Planning Ticket Label](/advanced/datastudio-data-model/models/jiralabel)
* [Planning Sprint](/advanced/datastudio-data-model/models/jirasprint)
* [Planning Ticket State Durations](/advanced/datastudio-data-model/models/jirastatedurations)
* [Contributor](/advanced/datastudio-data-model/models/contributor)
* [Team](/advanced/datastudio-data-model/models/team)


# Planning Ticket Custom Field

## Description

Values from custom fields related to Tickets.

## Measures

| Name                    | Title | Description                   |
| ----------------------- | ----- | ----------------------------- |
| `JiraCustomField.count` | Count | A count of the custom fields. |

## Dimensions

| Name                    | Title | Description                                                   |
| ----------------------- | ----- | ------------------------------------------------------------- |
| `JiraCustomField.id`    | Id    |                                                               |
| `JiraCustomField.name`  | Name  | The name of the custom field as defined in the planning tool. |
| `JiraCustomField.value` | Value | The value assigned to the custom field for a Ticket.          |

## Connected Cubes

All fields belonging to the following cubes are also reachable from JiraCustomField:

* [Planning Ticket Component](/advanced/datastudio-data-model/models/jiracomponent)
* [Planning Ticket Custom Field](/advanced/datastudio-data-model/models/jiracustomfield)
* [Epic](/advanced/datastudio-data-model/models/jiraepic)
* [Planning Ticket Hierarchy Issues](/advanced/datastudio-data-model/models/jirahierarchyissues)
* [Planning Ticket Hierarchy Issue Link](/advanced/datastudio-data-model/models/jiraissuehierarchylink)
* [Planning Ticket](/advanced/datastudio-data-model/models/jiraissuedetail)
* [Planning Ticket Event](/advanced/datastudio-data-model/models/jiraissueevent)
* [Planning Ticket Label](/advanced/datastudio-data-model/models/jiralabel)
* [Planning Sprint](/advanced/datastudio-data-model/models/jirasprint)
* [Planning Ticket State Durations](/advanced/datastudio-data-model/models/jirastatedurations)
* [Contributor](/advanced/datastudio-data-model/models/contributor)
* [Team](/advanced/datastudio-data-model/models/team)
* [Repositories](/advanced/datastudio-data-model/models/project)


# Epic

## Description

Metrics relating to Epics as imported from a planning tool (e.g. Jira).

## Measures

| Name                       | Title              | Description                                                           |
| -------------------------- | ------------------ | --------------------------------------------------------------------- |
| `JiraEpic.minCreatedAt`    | Min Created at     | Earliest creation date as a UNIX timestamp.                           |
| `JiraEpic.minAssignedAt`   | Min Assigned at    | Earliest assignment date as a UNIX timestamp.                         |
| `JiraEpic.minInProgressAt` | Min in Progress at | Earliest date an epic was marked as in progress, as a UNIX timestamp. |
| `JiraEpic.minResolvedAt`   | Min Resolved at    | Earliest resolution date as a UNIX timestamp.                         |
| `JiraEpic.minDueAt`        | Min Due at         | Earliest due date as a UNIX timestamp .                               |
| `JiraEpic.count`           | Count              | Total count of epics.                                                 |

## Dimensions

| Name                      | Title                           | Description                                                          |
| ------------------------- | ------------------------------- | -------------------------------------------------------------------- |
| `JiraEpic.id`             | Id                              |                                                                      |
| `JiraEpic.key`            | Key                             | Issue key associated with the epic as defined in the planning tool.  |
| `JiraEpic.parent`         | Parent                          | Parent issue key for the epic.                                       |
| `JiraEpic.name`           | Name                            | Name of the epic.                                                    |
| `JiraEpic.type`           | Type                            | Type of the epic.                                                    |
| `JiraEpic.status`         | Status                          | Status of the hierarchy issue (e.g., Open, Closed).                  |
| `JiraEpic.statusCategory` | Status Category                 | Category of the hierarchy issue's status (e.g., To Do, In Progress). |
| `JiraEpic.resolution`     | Resolution                      | Resolution of the hierarchy issue (e.g., Fixed, Closed).             |
| `JiraEpic.priority`       | Priority                        | Priority level of the hierarchy issue (e.g., high, low).             |
| `JiraEpic.createdAt`      | Created At (Unix Timestamp)     | Creation timestamp of the epic as a UNIX timestamp.                  |
| `JiraEpic.assignedAt`     | Assigned At (Unix Timestamp)    | Assignment timestamp of the epic as a UNIX timestamp.                |
| `JiraEpic.inProgressAt`   | In Progress At (Unix Timestamp) | In-progress timestamp of the epic as a UNIX timestamp.               |
| `JiraEpic.resolvedAt`     | Resolved At (Unix Timestamp)    | Resolution timestamp of the epic as a UNIX timestamp.                |
| `JiraEpic.dueAt`          | Due At (Unix Timestamp)         | Due date timestamp of the epic as a UNIX timestamp.                  |

## Connected Cubes

All fields belonging to the following cubes are also reachable from JiraEpic:

* [Planning Ticket Component](/advanced/datastudio-data-model/models/jiracomponent)
* [Planning Ticket Custom Field](/advanced/datastudio-data-model/models/jiracustomfield)
* [Epic](/advanced/datastudio-data-model/models/jiraepic)
* [Planning Ticket Hierarchy Issues](/advanced/datastudio-data-model/models/jirahierarchyissues)
* [Planning Ticket Hierarchy Issue Link](/advanced/datastudio-data-model/models/jiraissuehierarchylink)
* [Planning Ticket](/advanced/datastudio-data-model/models/jiraissuedetail)
* [Planning Ticket Event](/advanced/datastudio-data-model/models/jiraissueevent)
* [Planning Ticket Label](/advanced/datastudio-data-model/models/jiralabel)
* [Planning Sprint](/advanced/datastudio-data-model/models/jirasprint)
* [Planning Ticket State Durations](/advanced/datastudio-data-model/models/jirastatedurations)
* [Contributor](/advanced/datastudio-data-model/models/contributor)
* [Team](/advanced/datastudio-data-model/models/team)
* [Repositories](/advanced/datastudio-data-model/models/project)


# Planning Ticket Hierarchy Issues

## Description

Metrics relating to issues that are part of a structured hierarchy, such as Outcomes containing Initative, or Initatives containing Epics.

## Measures

| Name                                  | Title              | Description                                                                            |
| ------------------------------------- | ------------------ | -------------------------------------------------------------------------------------- |
| `JiraHierarchyIssues.minCreatedAt`    | Min Created at     | The smallest creation date for hierarchy issues, as a UNIX timestamp.                  |
| `JiraHierarchyIssues.minAssignedAt`   | Min Assigned at    | The smallest UNIX timestamp for when an hierarchy was assigned.                        |
| `JiraHierarchyIssues.minInProgressAt` | Min in Progress at | The smallest UNIX timestamp for when an hierarchy was marked in-progress.              |
| `JiraHierarchyIssues.minResolvedAt`   | Min Resolved at    | The smallest UNIX timestamp for when an hierarchy was resolved.                        |
| `JiraHierarchyIssues.minDueAt`        | Min Due at         | The smallest UNIX timestamp for when an hierarchy is due, as set in the planning tool. |
| `JiraHierarchyIssues.count`           | Count              | Total number of hierarchy issues.                                                      |

## Dimensions

| Name                                 | Title           | Description                                                            |
| ------------------------------------ | --------------- | ---------------------------------------------------------------------- |
| `JiraHierarchyIssues.id`             | Id              |                                                                        |
| `JiraHierarchyIssues.key`            | Key             | Key identifying the hierarchy issue, as defined in the planning tool.  |
| `JiraHierarchyIssues.name`           | Name            | Name or title of the hierarchy issue.                                  |
| `JiraHierarchyIssues.type`           | Type            | Type of the hierarchy issue (e.g., Outcome, Initative).                |
| `JiraHierarchyIssues.status`         | Status          | Status of the hierarchy issue (e.g., Open, Closed).                    |
| `JiraHierarchyIssues.statusCategory` | Status Category | Category of the hierarchy issue's status (e.g., To Do, In Progress).   |
| `JiraHierarchyIssues.resolution`     | Resolution      | Resolution of the hierarchy issue (e.g., Fixed, Closed).               |
| `JiraHierarchyIssues.priority`       | Priority        | Priority level of the hierarchy issue (e.g., high, low).               |
| `JiraHierarchyIssues.createdAt`      | Created at      | UNIX timestamp of when the hierarchy issue was created.                |
| `JiraHierarchyIssues.assignedAt`     | Assigned at     | UNIX timestamp of when the hierarchy issue was assigned a contributor. |
| `JiraHierarchyIssues.inProgressAt`   | In Progress at  | UNIX timestamp of when the hierarchy issue was marked as in progress.  |
| `JiraHierarchyIssues.resolvedAt`     | Resolved at     | UNIX timestamp of when the hierarchy issue was resolved.               |
| `JiraHierarchyIssues.dueAt`          | Due at          | UNIX timestamp of the hierarchy issue's due date.                      |

## Connected Cubes

All fields belonging to the following cubes are also reachable from JiraHierarchyIssues:

* [Planning Ticket Component](/advanced/datastudio-data-model/models/jiracomponent)
* [Planning Ticket Custom Field](/advanced/datastudio-data-model/models/jiracustomfield)
* [Epic](/advanced/datastudio-data-model/models/jiraepic)
* [Planning Ticket Hierarchy Issues](/advanced/datastudio-data-model/models/jirahierarchyissues)
* [Planning Ticket Hierarchy Issue Link](/advanced/datastudio-data-model/models/jiraissuehierarchylink)
* [Planning Ticket](/advanced/datastudio-data-model/models/jiraissuedetail)
* [Planning Ticket Event](/advanced/datastudio-data-model/models/jiraissueevent)
* [Planning Ticket Label](/advanced/datastudio-data-model/models/jiralabel)
* [Planning Sprint](/advanced/datastudio-data-model/models/jirasprint)
* [Planning Ticket State Durations](/advanced/datastudio-data-model/models/jirastatedurations)
* [Contributor](/advanced/datastudio-data-model/models/contributor)
* [Team](/advanced/datastudio-data-model/models/team)
* [Repositories](/advanced/datastudio-data-model/models/project)


# Planning Ticket Hierarchy Issue Link

## Description

Defines a hierarchy relationship between planning issues.

## Dimensions

| Name                         | Title | Description |
| ---------------------------- | ----- | ----------- |
| `JiraIssueHierarchyLink.id`  | Id    |             |
| `JiraIssueHierarchyLink.key` | Key   |             |

## Connected Cubes

All fields belonging to the following cubes are also reachable from JiraIssueHierarchyLink:

* [Planning Ticket Component](/advanced/datastudio-data-model/models/jiracomponent)
* [Planning Ticket Custom Field](/advanced/datastudio-data-model/models/jiracustomfield)
* [Epic](/advanced/datastudio-data-model/models/jiraepic)
* [Planning Ticket Hierarchy Issues](/advanced/datastudio-data-model/models/jirahierarchyissues)
* [Planning Ticket Hierarchy Issue Link](/advanced/datastudio-data-model/models/jiraissuehierarchylink)
* [Planning Ticket](/advanced/datastudio-data-model/models/jiraissuedetail)
* [Planning Ticket Event](/advanced/datastudio-data-model/models/jiraissueevent)
* [Planning Ticket Label](/advanced/datastudio-data-model/models/jiralabel)
* [Planning Sprint](/advanced/datastudio-data-model/models/jirasprint)
* [Planning Ticket State Durations](/advanced/datastudio-data-model/models/jirastatedurations)
* [Team](/advanced/datastudio-data-model/models/team)


# Planning Ticket

## Description

Metrics relating to tickets imported from a planning tool (e.g. Jira).

## Measures

| Name                                        | Title                        | Description                                                                                                |
| ------------------------------------------- | ---------------------------- | ---------------------------------------------------------------------------------------------------------- |
| `JiraIssueDetail.totalLeadTime`             | Total Lead Time              | The total time from ticket opening until it is closed/merged, in hours.                                    |
| `JiraIssueDetail.avgLeadTime`               | Avg Lead Time                | The average time from opening a ticket until it is closed/merged, in hours.                                |
| `JiraIssueDetail.medianLeadTime`            | Median Lead Time             | The median time from opening a ticket until it is closed/merged, in hours.                                 |
| `JiraIssueDetail.p90LeadTime`               | P90 Lead Time                | The 90th percentile time from opening a ticket until it is closed/merged, in hours.                        |
| `JiraIssueDetail.totalBacklogAge`           | Total Backlog Age            | The total time from ticket creation to an assignment to a contributor, in hours.                           |
| `JiraIssueDetail.avgBacklogAge`             | Avg Backlog Age              | The average time from ticket creation to an assignment to a contributor, in hours.                         |
| `JiraIssueDetail.medianBacklogAge`          | Median Backlog Age           | The median time from ticket creation to an assignment to a contributor, in hours.                          |
| `JiraIssueDetail.p90BacklogAge`             | P90 Backlog Age              | The 90th time from ticket creation to an assignment to a contributor, in hours.                            |
| `JiraIssueDetail.totalPickupTime`           | Total Pickup Time            | The total time from being assigned until its marked as in progress, in hours.                              |
| `JiraIssueDetail.avgPickupTime`             | Avg Pickup Time              | The average time from being assigned until iits marked as in progress, in hours                            |
| `JiraIssueDetail.medianPickupTime`          | Median Pickup Time           | The median time from being assigned until its marked in as progress, in hours                              |
| `JiraIssueDetail.p90PickupTime`             | P90 Pickup Time              | The 90th percentile time from being assigned until its marked as in progress, in hours.                    |
| `JiraIssueDetail.totalResolutionTime`       | Total Resolution Time        | The total time from being in progress until being marked as resolved/done for this ticket, in hours.       |
| `JiraIssueDetail.avgResolutionTime`         | Avg Resolution Time          | The average time from being in progress until being marked as resolved/done for this ticket, in hours.     |
| `JiraIssueDetail.medianResolutionTime`      | Median Resolution Time       | The median time from being in progress until being marked as resolved/done for this ticket, in hours.      |
| `JiraIssueDetail.p90ResolutionTime`         | P90 Resolution Time          | The 90th percentile time from being in progress until being marked as resolved/done this ticket, in hours. |
| `JiraIssueDetail.minCreatedAt`              | Min Created at               | The smallest UNIX timestamp when an issue was created.                                                     |
| `JiraIssueDetail.minAssignedAt`             | Min Assigned at              | The smallest UNIX timestamp when an issue was assigned a contributor.                                      |
| `JiraIssueDetail.minInProgressAt`           | Min in Progress at           | The smallest UNIX timestamp when an issue was marked as in progress.                                       |
| `JiraIssueDetail.minResolvedAt`             | Min Resolved at              | The smallest timestamp when an issue was resolved.                                                         |
| `JiraIssueDetail.totalStoryPoints`          | Total Story Points           | The total story points assigned.                                                                           |
| `JiraIssueDetail.totalTimeOriginalEstimate` | Total Time Original Estimate | The total original time estimate.                                                                          |
| `JiraIssueDetail.totalTimeEstimate`         | Total Time Estimate          | The total estimated time.                                                                                  |
| `JiraIssueDetail.totalTimeSpent`            | Total Time Spent             | The total time spent on issues.                                                                            |
| `JiraIssueDetail.count`                     | Count                        | The number of distinct issues.                                                                             |

## Dimensions

| Name                                      | Title                           | Description                                                                                    |
| ----------------------------------------- | ------------------------------- | ---------------------------------------------------------------------------------------------- |
| `JiraIssueDetail.timeInterval`            | Last Updated Time               | The time of the last update for the issue, obtained from the planning tool.                    |
| `JiraIssueDetail.timeIntervalCreatedTime` | Creation Time                   | Timestamp when the issue was created.                                                          |
| `JiraIssueDetail.id`                      | Id                              |                                                                                                |
| `JiraIssueDetail.key`                     | Key                             | Unique ID to identify the issue, assigned by the planning tool.                                |
| `JiraIssueDetail.type`                    | Type                            | Type of the issue.                                                                             |
| `JiraIssueDetail.status`                  | Status                          | Status of the issue, as defined by the planning tool.                                          |
| `JiraIssueDetail.statusCategory`          | Status Category                 | A standardised representation of the issue status, one of To Do, In Progress and Done.         |
| `JiraIssueDetail.resolution`              | Resolution                      | Resolution of the issue.                                                                       |
| `JiraIssueDetail.priority`                | Priority                        | Priority level of the issue.                                                                   |
| `JiraIssueDetail.title`                   | Title                           | Title or summary of the issue.                                                                 |
| `JiraIssueDetail.storyPoints`             | Story Points                    | Number of story points assigned to the issue.                                                  |
| `JiraIssueDetail.leadTime`                | Lead Time                       | The lifecycle time from creation to being closed for completed tickets, in hours.              |
| `JiraIssueDetail.backlogAge`              | Backlog Age                     | The time from ticket creation to an assignment to a contributor, in hours.                     |
| `JiraIssueDetail.pickupTime`              | Pickup Time                     | The time from being assigned until its status changes to an in-progress stage, in hours.       |
| `JiraIssueDetail.resolutionTime`          | Resolution Time                 | The time from being in progress until being marked as resolved/done for this ticket, in hours. |
| `JiraIssueDetail.createdAt`               | Created At (Unix Timestamp)     | The UNIX timestamp when the issue was created.                                                 |
| `JiraIssueDetail.assignedAt`              | Assigned At (Unix Timestamp)    | The UNIX timestamp when the issue was assigned.                                                |
| `JiraIssueDetail.inProgressAt`            | In Progress At (Unix Timestamp) | The UNIX timestamp when the issue was marked as in progress.                                   |
| `JiraIssueDetail.resolvedAt`              | Resolved At (Unix Timestamp)    | The UNIX timestamp when the issue was resolved.                                                |
| `JiraIssueDetail.timeOriginalEstimate`    | Time Original Estimate          | Original time estimate for the issue, in seconds.                                              |
| `JiraIssueDetail.timeEstimate`            | Time Estimate                   | Current remaining time estimate for the issue, in seconds.                                     |
| `JiraIssueDetail.timeSpent`               | Time Spent                      | Actual time spent working on the issue, in seconds.                                            |

## Connected Cubes

All fields belonging to the following cubes are also reachable from JiraIssueDetail:

* [Planning Ticket Component](/advanced/datastudio-data-model/models/jiracomponent)
* [Planning Ticket Custom Field](/advanced/datastudio-data-model/models/jiracustomfield)
* [Epic](/advanced/datastudio-data-model/models/jiraepic)
* [Planning Ticket Hierarchy Issues](/advanced/datastudio-data-model/models/jirahierarchyissues)
* [Planning Ticket Hierarchy Issue Link](/advanced/datastudio-data-model/models/jiraissuehierarchylink)
* [Planning Ticket](/advanced/datastudio-data-model/models/jiraissuedetail)
* [Planning Ticket Event](/advanced/datastudio-data-model/models/jiraissueevent)
* [Planning Ticket Label](/advanced/datastudio-data-model/models/jiralabel)
* [Planning Sprint](/advanced/datastudio-data-model/models/jirasprint)
* [Planning Ticket State Durations](/advanced/datastudio-data-model/models/jirastatedurations)
* [Contributor](/advanced/datastudio-data-model/models/contributor)
* [Team](/advanced/datastudio-data-model/models/team)
* [Pull Request](/advanced/datastudio-data-model/models/pullrequestdetail)
* [Pull Request Jira Issue](/advanced/datastudio-data-model/models/pullrequestjiraissue)
* [Pull Request Event](/advanced/datastudio-data-model/models/pullrequestevent)
* [Repositories](/advanced/datastudio-data-model/models/project)


# Planning Ticket Event

## Description

The events that relate to a Planning Ticket, such as when a Ticket is Open, Close or added to a Sprint.

## Measures

| Name                                 | Title                 | Description                                                               |
| ------------------------------------ | --------------------- | ------------------------------------------------------------------------- |
| `JiraIssueEvent.eventCount`          | Event Count           | A count of issue events.                                                  |
| `JiraIssueEvent.createdEventCount`   | Created Event Count   | A count of issue creation events.                                         |
| `JiraIssueEvent.resolvedEventCount`  | Resolved Event Count  | A count of issue resolution events.                                       |
| `JiraIssueEvent.accumulatedCreated`  | Accumulated Created   | A cumulative sum of issue creation events.                                |
| `JiraIssueEvent.accumulatedResolved` | Accumulated Resolved  | A cumulative sum of issue resolution events.                              |
| `JiraIssueEvent.minEventOccurredAt`  | Min Event Occurred at | The smallest timestamp for an issue event, expressed as a UNIX timestamp. |

## Dimensions

| Name                             | Title                       | Description                                                                             |
| -------------------------------- | --------------------------- | --------------------------------------------------------------------------------------- |
| `JiraIssueEvent.timeInterval`    | Time of Event               | The timestamp for when the issue event occurred.                                        |
| `JiraIssueEvent.id`              | Id                          |                                                                                         |
| `JiraIssueEvent.event`           | Event                       | The kind of event that occurred, such as Created or when an issue is added to a Sprint. |
| `JiraIssueEvent.eventOccurredAt` | Occured At (Unix Timestamp) | UNIX timestamp representation of when the issue event occurred.                         |

## Connected Cubes

All fields belonging to the following cubes are also reachable from JiraIssueEvent:

* [Planning Ticket Component](/advanced/datastudio-data-model/models/jiracomponent)
* [Planning Ticket Custom Field](/advanced/datastudio-data-model/models/jiracustomfield)
* [Epic](/advanced/datastudio-data-model/models/jiraepic)
* [Planning Ticket Hierarchy Issues](/advanced/datastudio-data-model/models/jirahierarchyissues)
* [Planning Ticket Hierarchy Issue Link](/advanced/datastudio-data-model/models/jiraissuehierarchylink)
* [Planning Ticket](/advanced/datastudio-data-model/models/jiraissuedetail)
* [Planning Ticket Event](/advanced/datastudio-data-model/models/jiraissueevent)
* [Planning Ticket Label](/advanced/datastudio-data-model/models/jiralabel)
* [Planning Sprint](/advanced/datastudio-data-model/models/jirasprint)
* [Planning Ticket State Durations](/advanced/datastudio-data-model/models/jirastatedurations)
* [Contributor](/advanced/datastudio-data-model/models/contributor)
* [Team](/advanced/datastudio-data-model/models/team)
* [Pull Request](/advanced/datastudio-data-model/models/pullrequestdetail)
* [Pull Request Jira Issue](/advanced/datastudio-data-model/models/pullrequestjiraissue)
* [Pull Request Event](/advanced/datastudio-data-model/models/pullrequestevent)
* [Repositories](/advanced/datastudio-data-model/models/project)


# Planning Ticket Label

## Description

Values of labels as they relate to Planning Tickets.

## Measures

| Name              | Title | Description                    |
| ----------------- | ----- | ------------------------------ |
| `JiraLabel.count` | Count | The number of distinct labels. |

## Dimensions

| Name             | Title | Description        |
| ---------------- | ----- | ------------------ |
| `JiraLabel.id`   | Id    |                    |
| `JiraLabel.name` | Name  | Name of the label. |

## Connected Cubes

All fields belonging to the following cubes are also reachable from JiraLabel:

* [Planning Ticket Component](/advanced/datastudio-data-model/models/jiracomponent)
* [Planning Ticket Custom Field](/advanced/datastudio-data-model/models/jiracustomfield)
* [Epic](/advanced/datastudio-data-model/models/jiraepic)
* [Planning Ticket Hierarchy Issues](/advanced/datastudio-data-model/models/jirahierarchyissues)
* [Planning Ticket Hierarchy Issue Link](/advanced/datastudio-data-model/models/jiraissuehierarchylink)
* [Planning Ticket](/advanced/datastudio-data-model/models/jiraissuedetail)
* [Planning Ticket Event](/advanced/datastudio-data-model/models/jiraissueevent)
* [Planning Ticket Label](/advanced/datastudio-data-model/models/jiralabel)
* [Planning Sprint](/advanced/datastudio-data-model/models/jirasprint)
* [Planning Ticket State Durations](/advanced/datastudio-data-model/models/jirastatedurations)
* [Contributor](/advanced/datastudio-data-model/models/contributor)
* [Team](/advanced/datastudio-data-model/models/team)
* [Repositories](/advanced/datastudio-data-model/models/project)


# Planning Project

## Description

Projects as imported from a planning tool.

## Measures

| Name                | Title | Description                      |
| ------------------- | ----- | -------------------------------- |
| `JiraProject.count` | Count | The number of distinct projects. |

## Dimensions

| Name                   | Title    | Description                        |
| ---------------------- | -------- | ---------------------------------- |
| `JiraProject.name`     | Name     | Name of the project.               |
| `JiraProject.id`       | Id       | Unique identifier for the project. |
| `JiraProject.table_id` | Table Id |                                    |

## Connected Cubes

All fields belonging to the following cubes are also reachable from JiraProject:

* [Planning Ticket Component](/advanced/datastudio-data-model/models/jiracomponent)
* [Planning Ticket Custom Field](/advanced/datastudio-data-model/models/jiracustomfield)
* [Epic](/advanced/datastudio-data-model/models/jiraepic)
* [Planning Ticket Hierarchy Issues](/advanced/datastudio-data-model/models/jirahierarchyissues)
* [Planning Ticket Hierarchy Issue Link](/advanced/datastudio-data-model/models/jiraissuehierarchylink)
* [Planning Ticket](/advanced/datastudio-data-model/models/jiraissuedetail)
* [Planning Ticket Event](/advanced/datastudio-data-model/models/jiraissueevent)
* [Planning Ticket Label](/advanced/datastudio-data-model/models/jiralabel)
* [Planning Sprint](/advanced/datastudio-data-model/models/jirasprint)
* [Planning Ticket State Durations](/advanced/datastudio-data-model/models/jirastatedurations)
* [Contributor](/advanced/datastudio-data-model/models/contributor)
* [Team](/advanced/datastudio-data-model/models/team)
* [Pull Request](/advanced/datastudio-data-model/models/pullrequestdetail)
* [Pull Request Jira Issue](/advanced/datastudio-data-model/models/pullrequestjiraissue)
* [Pull Request Event](/advanced/datastudio-data-model/models/pullrequestevent)


# Planning Ticket Release

## Description

Values of releases, as defined in a planning tool, and their relationship to Tickets.

## Measures

| Name                | Title | Description                      |
| ------------------- | ----- | -------------------------------- |
| `JiraRelease.count` | Count | The number of planning releases. |

## Dimensions

| Name                       | Title         | Description                          |
| -------------------------- | ------------- | ------------------------------------ |
| `JiraRelease.name`         | Name          | Name of the release.                 |
| `JiraRelease.id`           | Id            |                                      |
| `JiraRelease.timeInterval` | Released Time | Timestamp of the release deployment. |

## Connected Cubes

All fields belonging to the following cubes are also reachable from JiraRelease:

* [Planning Ticket Component](/advanced/datastudio-data-model/models/jiracomponent)
* [Planning Ticket Custom Field](/advanced/datastudio-data-model/models/jiracustomfield)
* [Epic](/advanced/datastudio-data-model/models/jiraepic)
* [Planning Ticket Hierarchy Issues](/advanced/datastudio-data-model/models/jirahierarchyissues)
* [Planning Ticket Hierarchy Issue Link](/advanced/datastudio-data-model/models/jiraissuehierarchylink)
* [Planning Ticket](/advanced/datastudio-data-model/models/jiraissuedetail)
* [Planning Ticket Event](/advanced/datastudio-data-model/models/jiraissueevent)
* [Planning Ticket Label](/advanced/datastudio-data-model/models/jiralabel)
* [Planning Sprint](/advanced/datastudio-data-model/models/jirasprint)
* [Planning Ticket State Durations](/advanced/datastudio-data-model/models/jirastatedurations)


# Planning Sprint

## Description

Metrics relating to sprints imported from a planning tool (e.g. Jira).

## Measures

| Name                              | Title                  | Description                                                    |
| --------------------------------- | ---------------------- | -------------------------------------------------------------- |
| `JiraSprint.minStartedAt`         | Min Started at         | The smallest start time for sprints, as a UNIX timestamp.      |
| `JiraSprint.minEndedAt`           | Min Ended at           | The smallest end time for sprints, as a UNIX timestamp.        |
| `JiraSprint.minCompletedAt`       | Min Completed at       | The smallest completion time for sprints, as a UNIX timestamp. |
| `JiraSprint.count`                | Count                  | Total number of sprints.                                       |
| `JiraSprint.storyPoints`          | Story Points           | Total story points planned for sprints.                        |
| `JiraSprint.completedStoryPoints` | Completed Story Points | Total story points completed for sprints.                      |
| `JiraSprint.leftoverStoryPoints`  | Leftover Story Points  | Total story points not completed by the end the sprints.       |

## Dimensions

| Name                                 | Title                         | Description                                                              |
| ------------------------------------ | ----------------------------- | ------------------------------------------------------------------------ |
| `JiraSprint.id`                      | Id                            |                                                                          |
| `JiraSprint.key`                     | Key                           | Unique identifier for the sprint.                                        |
| `JiraSprint.name`                    | Name                          | Name of the sprint.                                                      |
| `JiraSprint.timeInterval`            | Started Time                  | The planned start timestamp for this sprint.                             |
| `JiraSprint.timeIntervalEndedAt`     | Ended Time                    | The planned end timestamp for this sprint.                               |
| `JiraSprint.timeIntervalCompletedAt` | Completed Time                | The timestamp of when the sprint was concluded by a user.                |
| `JiraSprint.storyPointsDim`          | Story Points Dim              |                                                                          |
| `JiraSprint.completedStoryPointsDim` | Completed Story Points Dim    |                                                                          |
| `JiraSprint.leftoverStoryPointsDim`  | Leftover Story Points Dim     |                                                                          |
| `JiraSprint.startedAt`               | Started At (Unix Timestamp)   | The planned start date for this sprint as a UNIX timestamp.              |
| `JiraSprint.endedAt`                 | Ended At (Unix Timestamp)     | The planned end date for this sprint as a UNIX timestamp.                |
| `JiraSprint.completedAt`             | Completed At (Unix Timestamp) | The time of when the sprint was concluded by a user as a UNIX timestamp. |

## Connected Cubes

All fields belonging to the following cubes are also reachable from JiraSprint:

* [Planning Ticket Component](/advanced/datastudio-data-model/models/jiracomponent)
* [Planning Ticket Custom Field](/advanced/datastudio-data-model/models/jiracustomfield)
* [Epic](/advanced/datastudio-data-model/models/jiraepic)
* [Planning Ticket Hierarchy Issues](/advanced/datastudio-data-model/models/jirahierarchyissues)
* [Planning Ticket Hierarchy Issue Link](/advanced/datastudio-data-model/models/jiraissuehierarchylink)
* [Planning Ticket](/advanced/datastudio-data-model/models/jiraissuedetail)
* [Planning Ticket Event](/advanced/datastudio-data-model/models/jiraissueevent)
* [Planning Ticket Label](/advanced/datastudio-data-model/models/jiralabel)
* [Planning Sprint](/advanced/datastudio-data-model/models/jirasprint)
* [Planning Ticket State Durations](/advanced/datastudio-data-model/models/jirastatedurations)
* [Contributor](/advanced/datastudio-data-model/models/contributor)
* [Team](/advanced/datastudio-data-model/models/team)
* [Repositories](/advanced/datastudio-data-model/models/project)


# Planning Ticket State Durations

## Description

Metrics relating to custom-states as defined in a planning tool, and the duration in which a Planning Ticket spends in each state.

## Measures

| Name                                | Title           | Description                                                |
| ----------------------------------- | --------------- | ---------------------------------------------------------- |
| `JiraStateDurations.count`          | Count           | A count of the possible issue states.                      |
| `JiraStateDurations.totalDuration`  | Total Duration  | The total duration of issues in the issue state.           |
| `JiraStateDurations.avgDuration`    | Avg Duration    | The average duration of issues in the issue state.         |
| `JiraStateDurations.medianDuration` | Median Duration | The median duration of issues in the issue state.          |
| `JiraStateDurations.p90Duration`    | P90 Duration    | The 90th percentile duration of issues in the issue state. |

## Dimensions

| Name                           | Title      | Description                                                     |
| ------------------------------ | ---------- | --------------------------------------------------------------- |
| `JiraStateDurations.id`        | Id         |                                                                 |
| `JiraStateDurations.stateName` | State Name | The name of the user-defined state.                             |
| `JiraStateDurations.duration`  | Duration   | The duration, in seconds, that an issue remained in this state. |

## Connected Cubes

All fields belonging to the following cubes are also reachable from JiraStateDurations:

* [Planning Ticket Component](/advanced/datastudio-data-model/models/jiracomponent)
* [Planning Ticket Custom Field](/advanced/datastudio-data-model/models/jiracustomfield)
* [Epic](/advanced/datastudio-data-model/models/jiraepic)
* [Planning Ticket Hierarchy Issues](/advanced/datastudio-data-model/models/jirahierarchyissues)
* [Planning Ticket Hierarchy Issue Link](/advanced/datastudio-data-model/models/jiraissuehierarchylink)
* [Planning Ticket](/advanced/datastudio-data-model/models/jiraissuedetail)
* [Planning Ticket Event](/advanced/datastudio-data-model/models/jiraissueevent)
* [Planning Ticket Label](/advanced/datastudio-data-model/models/jiralabel)
* [Planning Sprint](/advanced/datastudio-data-model/models/jirasprint)
* [Planning Ticket State Durations](/advanced/datastudio-data-model/models/jirastatedurations)
* [Contributor](/advanced/datastudio-data-model/models/contributor)
* [Team](/advanced/datastudio-data-model/models/team)
* [Repositories](/advanced/datastudio-data-model/models/project)


# Repositories

## Description

A repository as imported by a code repository tool (e.g. GitHub, GitLab).

## Measures

| Name            | Title | Description                   |
| --------------- | ----- | ----------------------------- |
| `Project.count` | Count | Total number of repositories. |

## Dimensions

| Name               | Title    | Description                              |
| ------------------ | -------- | ---------------------------------------- |
| `Project.name`     | Name     | The name of the repository.              |
| `Project.id`       | Id       | The unique identifier of the repository. |
| `Project.table_id` | Table Id |                                          |

## Connected Cubes

All fields belonging to the following cubes are also reachable from Project:

* [Repositories](/advanced/datastudio-data-model/models/project)
* [CI Build](/advanced/datastudio-data-model/models/cibuild)
* [CI Build Stage](/advanced/datastudio-data-model/models/cibuildstage)
* [Contributor](/advanced/datastudio-data-model/models/contributor)
* [Team](/advanced/datastudio-data-model/models/team)
* [Pull Request](/advanced/datastudio-data-model/models/pullrequestdetail)
* [Pull Request Jira Issue](/advanced/datastudio-data-model/models/pullrequestjiraissue)
* [Pull Request Event](/advanced/datastudio-data-model/models/pullrequestevent)
* [Planning Ticket Component](/advanced/datastudio-data-model/models/jiracomponent)
* [Planning Ticket Custom Field](/advanced/datastudio-data-model/models/jiracustomfield)
* [Epic](/advanced/datastudio-data-model/models/jiraepic)
* [Planning Ticket Hierarchy Issues](/advanced/datastudio-data-model/models/jirahierarchyissues)
* [Planning Ticket Hierarchy Issue Link](/advanced/datastudio-data-model/models/jiraissuehierarchylink)
* [Planning Ticket](/advanced/datastudio-data-model/models/jiraissuedetail)
* [Planning Ticket Event](/advanced/datastudio-data-model/models/jiraissueevent)
* [Planning Ticket Label](/advanced/datastudio-data-model/models/jiralabel)
* [Planning Sprint](/advanced/datastudio-data-model/models/jirasprint)
* [Planning Ticket State Durations](/advanced/datastudio-data-model/models/jirastatedurations)
* [Release](/advanced/datastudio-data-model/models/release)
* [Coverage Commit](/advanced/datastudio-data-model/models/coveragecommit)
* [Coverage Custom Fields](/advanced/datastudio-data-model/models/coveragecustomfield)
* [Coverage File](/advanced/datastudio-data-model/models/coveragefile)
* [Coverage Labels](/advanced/datastudio-data-model/models/coveragelabel)
* [Coverage Test Result](/advanced/datastudio-data-model/models/coveragetestresult)


# Pull Request

## Description

Metrics relating to Pull Requests imported from a code repository tool (e.g. GitHub, GitLab).

## Measures

| Name                                               | Title                              | Description                                                                                                                                      |
| -------------------------------------------------- | ---------------------------------- | ------------------------------------------------------------------------------------------------------------------------------------------------ |
| `PullRequestDetail.elapseTime`                     | Elapse Time                        | The time from the first commit or the start of pull requests to its closure or merge, in hours.                                                  |
| `PullRequestDetail.totalCycleTime`                 | Total Cycle Time                   | The total time from first commit to merge or closure pull requests, in hours.                                                                    |
| `PullRequestDetail.avgCycleTime`                   | Avg Cycle Time                     | Average time from first commit to merge or closure of pull requests, in hours.                                                                   |
| `PullRequestDetail.medianCycleTime`                | Median Cycle Time                  | The median time from first commit to merge or closure of pull requests, in hours.                                                                |
| `PullRequestDetail.p90CycleTime`                   | P90 Cycle Time                     | The 90th percentile time from first commit to merge or closure of pull requests, in hours.                                                       |
| `PullRequestDetail.minCycleTime`                   | Min Cycle Time                     | The quickest time from first commit to merge or closure of pull requests, in hours.                                                              |
| `PullRequestDetail.maxCycleTime`                   | Max Cycle Time                     | The slowest time from first commit to merge or closure of pull requests, in hours.                                                               |
| `PullRequestDetail.totalDevelopmentTime`           | Total Development Time             | The total time from the first commit to opening the PR, in hours.                                                                                |
| `PullRequestDetail.avgDevelopmentTime`             | Avg Development Time               | The average time from the first commit to opening the PR, in hours.                                                                              |
| `PullRequestDetail.medianDevelopmentTime`          | Median Development Time            | The median time from the first commit to opening the PR, in hours.                                                                               |
| `PullRequestDetail.p90DevelopmentTime`             | P90 Development Time               | The 90th percentile time from the first commit to opening the PR, in hours.                                                                      |
| `PullRequestDetail.minDevelopmentTime`             | Min Development Time               | The earliest time from the first commit to opening the PR, in hours.                                                                             |
| `PullRequestDetail.maxDevelopmentTime`             | Max Development Time               | The slowest time from the first commit to opening the PR, in hours.                                                                              |
| `PullRequestDetail.minFirstCommittedAt`            | Min First Committed at             | Earliest UNIX timestamp for the first commit.                                                                                                    |
| `PullRequestDetail.minReviewRequestedAt`           | Min Review Requested at            | Earliest UNIX timestamp for the review request.                                                                                                  |
| `PullRequestDetail.totalResponseTime`              | Total Response Time                | Total time from PR opening to the first code review, in hours.                                                                                   |
| `PullRequestDetail.avgResponseTime`                | Avg Response Time                  | Average time from PR opening to the first review, in hours.                                                                                      |
| `PullRequestDetail.medianResponseTime`             | Median Response Time               | Median response time, the middle value of time from PR opening to first review, in hours.                                                        |
| `PullRequestDetail.p90ResponseTime`                | P90 Response Time                  | The 90th time from PR opening to the first review, in hours.                                                                                     |
| `PullRequestDetail.minResponseTime`                | Min Response Time                  | Minimum time from PR opening to first review, in hours.                                                                                          |
| `PullRequestDetail.maxResponseTime`                | Max Response Time                  | Maximum time from PR opening to first review, in hours.                                                                                          |
| `PullRequestDetail.minFirstReviewedAt`             | Min First Reviewed at              | UNIX timestamp when a pull request was first reviewed.                                                                                           |
| `PullRequestDetail.totalReviewTime`                | Total Review Time                  | The total time from PR opening to its merge or closure, in hours.                                                                                |
| `PullRequestDetail.avgReviewTime`                  | Avg Review Time                    | The average time from PR opening to its merge or closure, in hours.                                                                              |
| `PullRequestDetail.medianReviewTime`               | Median Review Time                 | The median time from PR opening to its merge or closure, in hours.                                                                               |
| `PullRequestDetail.p90ReviewTime`                  | P90 Review Time                    | The 90th percentile time from PR opening to its merge or closure, in hours.                                                                      |
| `PullRequestDetail.minReviewTime`                  | Min Review Time                    | The quickest time from PR opening to its merge or closure, in hours.                                                                             |
| `PullRequestDetail.maxReviewTime`                  | Max Review Time                    | The slowest time from PR opening to its merge or closure, in hours.                                                                              |
| `PullRequestDetail.minApprovedAt`                  | Min Approved at                    | The earliest approval UNIX timestamp for pull requests.                                                                                          |
| `PullRequestDetail.totalIntegrationTime`           | Total Integration Time             | The total time from approval of the PR until its merge/closure, in hours..                                                                       |
| `PullRequestDetail.avgIntegrationTime`             | Avg Integration Time               | The average time from approval of the PR until its merge/closure, in hours.                                                                      |
| `PullRequestDetail.medianIntegrationTime`          | Median Integration Time            | The median time from approval of the PR until its merge/closure, in hours.                                                                       |
| `PullRequestDetail.p90IntegrationTime`             | P90 Integration Time               | The 90th percentile time from approval of the PR until its merge/closure, in hours.                                                              |
| `PullRequestDetail.minIntegrationTime`             | Min Integration Time               | The quickest time from approval of the PR until its merge/closure, in hours.                                                                     |
| `PullRequestDetail.maxIntegrationTime`             | Max Integration Time               | The slowest time from approval of the PR until its merge/closure, in hours.                                                                      |
| `PullRequestDetail.minMergedAt`                    | Min Merged at                      | The UNIX timestamp of the earliest merged time.                                                                                                  |
| `PullRequestDetail.totalClosingTime`               | Total Closing Time                 | The total closing time for pull requests closed without merging, in hours.                                                                       |
| `PullRequestDetail.avgClosingTime`                 | Avg Closing Time                   | The average closing time for pull requests closed without merging, in hours.                                                                     |
| `PullRequestDetail.medianClosingTime`              | Median Closing Time                | The median closing time for pull requests closed without merging, in hours.                                                                      |
| `PullRequestDetail.p90ClosingTime`                 | P90 Closing Time                   | The 90th percentile of closing time for pull requests closed without merging.                                                                    |
| `PullRequestDetail.minClosingTime`                 | Min Closing Time                   | The minimum UNIX timestamp of closing time for pull requests closed without merging.                                                             |
| `PullRequestDetail.maxClosingTime`                 | Max Closing Time                   | The maximum UNIX timestamp for pull requests closed without merging.                                                                             |
| `PullRequestDetail.minClosedAt`                    | Min Closed at                      | The minimum UNIX timestamp of when a pull request was closed.                                                                                    |
| `PullRequestDetail.totalCommentsCount`             | Total Comments Count               | The total number of comments across pull requests.                                                                                               |
| `PullRequestDetail.avgCommentsCount`               | Avg Comments Count                 | The average number of comments on pull requests.                                                                                                 |
| `PullRequestDetail.minCommentsCount`               | Min Comments Count                 | The minimum number of comments on pull request.                                                                                                  |
| `PullRequestDetail.maxCommentsCount`               | Max Comments Count                 | The maximum number of comments on pull request.                                                                                                  |
| `PullRequestDetail.totalCommitsCount`              | Total Commits Count                | The total number of commits across pull requests.                                                                                                |
| `PullRequestDetail.avgCommitsCount`                | Avg Commits Count                  | The average number of commits in pull requests.                                                                                                  |
| `PullRequestDetail.minCommitsCount`                | Min Commits Count                  | The minimum number of commits on pull requests.                                                                                                  |
| `PullRequestDetail.maxCommitsCount`                | Max Commits Count                  | The maximum number of commits on pull requests.                                                                                                  |
| `PullRequestDetail.totalWorkTypeNew`               | Total Work Type New                | The total lines of code of new work done across pull requests.                                                                                   |
| `PullRequestDetail.workTypeNewPercentage`          | Work Type New Percentage           | The percentage of new work relative to the total code change size.                                                                               |
| `PullRequestDetail.totalWorkTypeMaintenance`       | Total Work Type Maintenance        | The total lines of code of maintenance work done across pull requests.                                                                           |
| `PullRequestDetail.workTypeMaintenancePercentage`  | Work Type Maintenance Percentage   | The percentage of maintenance work relative to the total code change size.                                                                       |
| `PullRequestDetail.totalWorkTypeReworkOwn`         | Total Work Type Rework Own         | The total lines of code of rework of the author's own code done on pull requests.                                                                |
| `PullRequestDetail.workTypeReworkOwnPercentage`    | Work Type Rework Own Percentage    | The percentage of rework of the authors's own code relative to the total code change size.                                                       |
| `PullRequestDetail.totalWorkTypeReworkOthers`      | Total Work Type Rework Others      | The total lines of code of other contributors rework code done on pull requests.                                                                 |
| `PullRequestDetail.workTypeReworkOthersPercentage` | Work Type Rework Others Percentage | The percentage of rework of other contributors code relative to the total code change size.                                                      |
| `PullRequestDetail.totalCodeChangeSize`            | Total Code Change Size             | The total number of lines of code changed (added, removed, or modified) in the pull request, including overlapping lines counted multiple times. |
| `PullRequestDetail.avgCodeChangeSize`              | Avg Code Change Size               | The average number of lines of code changed (added, removed, or modified) in pull requests.                                                      |
| `PullRequestDetail.minCodeChangeSize`              | Min Code Change Size               | The minimum number of lines of code changed (added, removed, or modified) in pull requests.                                                      |
| `PullRequestDetail.maxCodeChangeSize`              | Max Code Change Size               | The maximum number of lines of code changed (added, removed, or modified) in pull requests.                                                      |
| `PullRequestDetail.totalFilesCount`                | Total Files Count                  | The total number of files changed across pull requests.                                                                                          |
| `PullRequestDetail.avgFilesCount`                  | Avg Files Count                    | The average number of files changed per pull request.                                                                                            |
| `PullRequestDetail.minFilesCount`                  | Min Files Count                    | The minimum number of files changed across pull requests.                                                                                        |
| `PullRequestDetail.maxFilesCount`                  | Max Files Count                    | The maximum number of files changed across pull requests.                                                                                        |
| `PullRequestDetail.totalReviewedFileCount`         | Total Reviewed File Count          | The total number of files that received a review in pull requests.                                                                               |
| `PullRequestDetail.avgReviewedFileCount`           | Avg Reviewed File Count            | The average number of files reviewed for pull requests.                                                                                          |
| `PullRequestDetail.minReviewedFileCount`           | Min Reviewed File Count            | The minimum number of files reviewed in pull requests.                                                                                           |
| `PullRequestDetail.maxReviewedFileCount`           | Max Reviewed File Count            | The maximum number of files reviewed in pull requests.                                                                                           |
| `PullRequestDetail.reviewCoverage`                 | Review Coverage                    | The percentage of files that received at least one code review comment relative to the total number of files changed.                            |
| `PullRequestDetail.totalReviewersCount`            | Total Reviewers Count              | The total number of reviewers involved across pull requests.                                                                                     |
| `PullRequestDetail.avgReviewersCount`              | Avg Reviewers Count                | The average number of reviewers for pull requests.                                                                                               |
| `PullRequestDetail.minReviewersCount`              | Min Reviewers Count                | The minimum number of reviewers for pull requests.                                                                                               |
| `PullRequestDetail.maxReviewersCount`              | Max Reviewers Count                | The maximum number of reviewers for pull requests.                                                                                               |
| `PullRequestDetail.totalReviewCycles`              | Total Review Cycles                | The total number of times pull requests go back and forth between the author and reviewers for additional changes.                               |
| `PullRequestDetail.avgReviewCycles`                | Avg Review Cycles                  | The average number of review cycles for pull requests.                                                                                           |
| `PullRequestDetail.minReviewCycles`                | Min Review Cycles                  | The minimum number of review cycles for pull requests.                                                                                           |
| `PullRequestDetail.maxReviewCycles`                | Max Review Cycles                  | The maximum number of review cycles for pull requests.                                                                                           |
| `PullRequestDetail.count`                          | Count                              | The total count of pull requests.                                                                                                                |
| `PullRequestDetail.allCount`                       | All Count                          | The cumulative count of all pull requests across all time.                                                                                       |
| `PullRequestDetail.allMerged`                      | All Merged                         | The cumulative count of merged pull requests across all time.                                                                                    |
| `PullRequestDetail.allClosed`                      | All Closed                         | The cumulative count of closed pull requests across all time.                                                                                    |

## Dimensions

| Name                                              | Title                                | Description                                                                                                            |
| ------------------------------------------------- | ------------------------------------ | ---------------------------------------------------------------------------------------------------------------------- |
| `PullRequestDetail.timeInterval`                  | Opening Time                         | The time when the pull request was opened.                                                                             |
| `PullRequestDetail.timeIntervalLastUpdatedAtTime` | Last Updated Time                    | The timestamp when the pull request was last updated, obtained from the repository service.                            |
| `PullRequestDetail.mergedTimetimeInterval`        | Merged Time                          | The timestamp when the pull request was merged.                                                                        |
| `PullRequestDetail.closedTimetimeInterval`        | Closed Time                          | The timestamp when the pull request was closed.                                                                        |
| `PullRequestDetail.id`                            | Id                                   |                                                                                                                        |
| `PullRequestDetail.number`                        | Number                               | The associated pull requests ID, as provided by the repository service.                                                |
| `PullRequestDetail.title`                         | Title                                | The title of the pull request.                                                                                         |
| `PullRequestDetail.workType`                      | Work Type                            | The type of work associated with the pull request, such as New, Maintenance, or Rework.                                |
| `PullRequestDetail.state`                         | State                                | The state of the pull request, such as Open or Approved.                                                               |
| `PullRequestDetail.cycleTime`                     | Cycle Time                           | The time from first commit to merge or closure of pull requests, in hours.                                             |
| `PullRequestDetail.developmentTime`               | Development Time                     | The time from the first commit to the opening the PR, in hours.                                                        |
| `PullRequestDetail.firstCommittedAt`              | First Commit At (Unix Timestamp)     | The UNIX timestamp of the first commit made in the pull request.                                                       |
| `PullRequestDetail.reviewRequestedAt`             | Review Requested At (Unix Timestamp) | The UNIX timestamp when a review was first requested for the pull request.                                             |
| `PullRequestDetail.responseTime`                  | Response Time                        | The time taken from opening the PR to the first review, in hours.                                                      |
| `PullRequestDetail.firstReviewedAt`               | First Review At (Unix Timestamp)     | The UNIX timestamp when the pull request was first reviewed.                                                           |
| `PullRequestDetail.reviewTime`                    | Review Time                          | The total time from first review response to approval of the PR, in hours.                                             |
| `PullRequestDetail.approvedAt`                    | Approved At (Unix Timestamp)         | The UNIX timestamp when the pull request was approved.                                                                 |
| `PullRequestDetail.integrationTime`               | Integration Time                     | The time from approval of the PR until its merge/closure, in hours.                                                    |
| `PullRequestDetail.mergedAt`                      | Merged At (Unix Timestamp)           | The UNIX timestamp when the pull request was merged.                                                                   |
| `PullRequestDetail.closingTime`                   | Closing Time                         | The time taken to close the pull request, in hours.                                                                    |
| `PullRequestDetail.closedAt`                      | Closed At (Unix Timestamp)           | The UNIX timestamp when the pull request was closed.                                                                   |
| `PullRequestDetail.commentsCount`                 | Comments Count                       | The number of comments made on the pull request.                                                                       |
| `PullRequestDetail.commitsCount`                  | Commits Count                        | The number of commits associated with the pull request.                                                                |
| `PullRequestDetail.workTypeNew`                   | Work Type New                        | The total lines of code for newly added code for a pull request.                                                       |
| `PullRequestDetail.workTypeMaintenance`           | Work Type Maintenance                | The total lines of code that are changes to code older than 3 months for a pull request.                               |
| `PullRequestDetail.workTypeReworkOwn`             | Work Type Rework Own                 | The total lines of code that are changes to the author's own code, that is less than 3 months old, for a pull request. |
| `PullRequestDetail.workTypeReworkOthers`          | Work Type Rework Others              | The total lines of code that are changes to other people's code, that is less than 3 months old, for a pull request.   |
| `PullRequestDetail.codeChangeSize`                | Code Change Size                     | The total size of the code changes made in the pull request.                                                           |
| `PullRequestDetail.filesCount`                    | Files Count                          | The number of files affected by the pull request.                                                                      |
| `PullRequestDetail.reviewedFileCount`             | Reviewed File Count                  | The number of files that were reviewed in the pull request.                                                            |
| `PullRequestDetail.reviewersCount`                | Reviewers Count                      | The number of reviewers assigned to the pull request.                                                                  |
| `PullRequestDetail.reviewCycles`                  | Review Cycles                        | The number of review cycles the pull request went through before being merged or closed.                               |
| `PullRequestDetail.aiCommitCount`                 | AI Commit Count                      | The number of AI-assisted commits within this pull request.                                                            |
| `PullRequestDetail.isDraft`                       | Is Draft                             | Whether the pull request is a draft.                                                                                   |

## Connected Cubes

All fields belonging to the following cubes are also reachable from PullRequestDetail:

* [Pull Request](/advanced/datastudio-data-model/models/pullrequestdetail)
* [Pull Request Jira Issue](/advanced/datastudio-data-model/models/pullrequestjiraissue)
* [Pull Request Event](/advanced/datastudio-data-model/models/pullrequestevent)
* [Contributor](/advanced/datastudio-data-model/models/contributor)
* [Team](/advanced/datastudio-data-model/models/team)
* [CI Build](/advanced/datastudio-data-model/models/cibuild)
* [CI Build Stage](/advanced/datastudio-data-model/models/cibuildstage)
* [Planning Ticket Component](/advanced/datastudio-data-model/models/jiracomponent)
* [Planning Ticket Custom Field](/advanced/datastudio-data-model/models/jiracustomfield)
* [Epic](/advanced/datastudio-data-model/models/jiraepic)
* [Planning Ticket Hierarchy Issues](/advanced/datastudio-data-model/models/jirahierarchyissues)
* [Planning Ticket Hierarchy Issue Link](/advanced/datastudio-data-model/models/jiraissuehierarchylink)
* [Planning Ticket](/advanced/datastudio-data-model/models/jiraissuedetail)
* [Planning Ticket Event](/advanced/datastudio-data-model/models/jiraissueevent)
* [Planning Ticket Label](/advanced/datastudio-data-model/models/jiralabel)
* [Planning Sprint](/advanced/datastudio-data-model/models/jirasprint)
* [Planning Ticket State Durations](/advanced/datastudio-data-model/models/jirastatedurations)
* [Repositories](/advanced/datastudio-data-model/models/project)


# Pull Request Jira Issue

## Description

Defines a link between Pull Requests and Planning Tickets.

## Dimensions

| Name                                           | Title                      | Description                                    |
| ---------------------------------------------- | -------------------------- | ---------------------------------------------- |
| `PullRequestJiraIssue.id`                      | Id                         |                                                |
| `PullRequestJiraIssue.linkedPullRequestTicket` | Linked Pull Request Ticket | The Ticket ID that is linked to a Pull Request |

## Connected Cubes

All fields belonging to the following cubes are also reachable from PullRequestJiraIssue:

* [Pull Request](/advanced/datastudio-data-model/models/pullrequestdetail)
* [Pull Request Jira Issue](/advanced/datastudio-data-model/models/pullrequestjiraissue)
* [Pull Request Event](/advanced/datastudio-data-model/models/pullrequestevent)
* [Repositories](/advanced/datastudio-data-model/models/project)


# Pull Request Event

## Description

The events that relate to a Pull Request, such as when a PR is Open, Closed or a review occurs.

## Measures

| Name                                  | Title                | Description                                                        |
| ------------------------------------- | -------------------- | ------------------------------------------------------------------ |
| `PullRequestEvent.totalEventDuration` | Total Event Duration | Total time across events.                                          |
| `PullRequestEvent.avgEventDuration`   | Avg Event Duration   | Average time across events.                                        |
| `PullRequestEvent.minEventDuration`   | Min Event Duration   | Shortest time recorded across events.                              |
| `PullRequestEvent.maxEventDuration`   | Max Event Duration   | Longest time recorded across events.                               |
| `PullRequestEvent.eventCount`         | Event Count          | Total number of pull request events.                               |
| `PullRequestEvent.accEventCount`      | Acc Event Count      | Running total of pull request events over time.                    |
| `PullRequestEvent.accOpening`         | Acc Opening          | Cumulative count of PRs that were opened (state = 'Open').         |
| `PullRequestEvent.accClosing`         | Acc Closing          | Cumulative count of PRs that were closed (state = 'Closed').       |
| `PullRequestEvent.active`             | Active               | Number of active PRs, based on difference in sum of open vs closed |

## Dimensions

| Name                             | Title          | Description                                                |
| -------------------------------- | -------------- | ---------------------------------------------------------- |
| `PullRequestEvent.timeInterval`  | Time of Event  | Timestamp indicating when the pull request event occurred. |
| `PullRequestEvent.id`            | Id             |                                                            |
| `PullRequestEvent.event`         | Event          | A label representing the pull request event type.          |
| `PullRequestEvent.eventDuration` | Event Duration | Duration between the last event and this event.            |

## Connected Cubes

All fields belonging to the following cubes are also reachable from PullRequestEvent:

* [Pull Request](/advanced/datastudio-data-model/models/pullrequestdetail)
* [Pull Request Jira Issue](/advanced/datastudio-data-model/models/pullrequestjiraissue)
* [Pull Request Event](/advanced/datastudio-data-model/models/pullrequestevent)
* [Contributor](/advanced/datastudio-data-model/models/contributor)
* [Team](/advanced/datastudio-data-model/models/team)
* [CI Build](/advanced/datastudio-data-model/models/cibuild)
* [CI Build Stage](/advanced/datastudio-data-model/models/cibuildstage)
* [Planning Ticket Component](/advanced/datastudio-data-model/models/jiracomponent)
* [Planning Ticket Custom Field](/advanced/datastudio-data-model/models/jiracustomfield)
* [Epic](/advanced/datastudio-data-model/models/jiraepic)
* [Planning Ticket Hierarchy Issues](/advanced/datastudio-data-model/models/jirahierarchyissues)
* [Planning Ticket Hierarchy Issue Link](/advanced/datastudio-data-model/models/jiraissuehierarchylink)
* [Planning Ticket](/advanced/datastudio-data-model/models/jiraissuedetail)
* [Planning Ticket Event](/advanced/datastudio-data-model/models/jiraissueevent)
* [Planning Ticket Label](/advanced/datastudio-data-model/models/jiralabel)
* [Planning Sprint](/advanced/datastudio-data-model/models/jirasprint)
* [Planning Ticket State Durations](/advanced/datastudio-data-model/models/jirastatedurations)
* [Repositories](/advanced/datastudio-data-model/models/project)


---

[Next Page](/llms-full.txt/1)